State and Trends of Australia's Oceans - an overview
The 27 time series have brought together a plethora of information from around Australia. This section summarises the main findings from the time series by marine bioregion and some other regional areas.
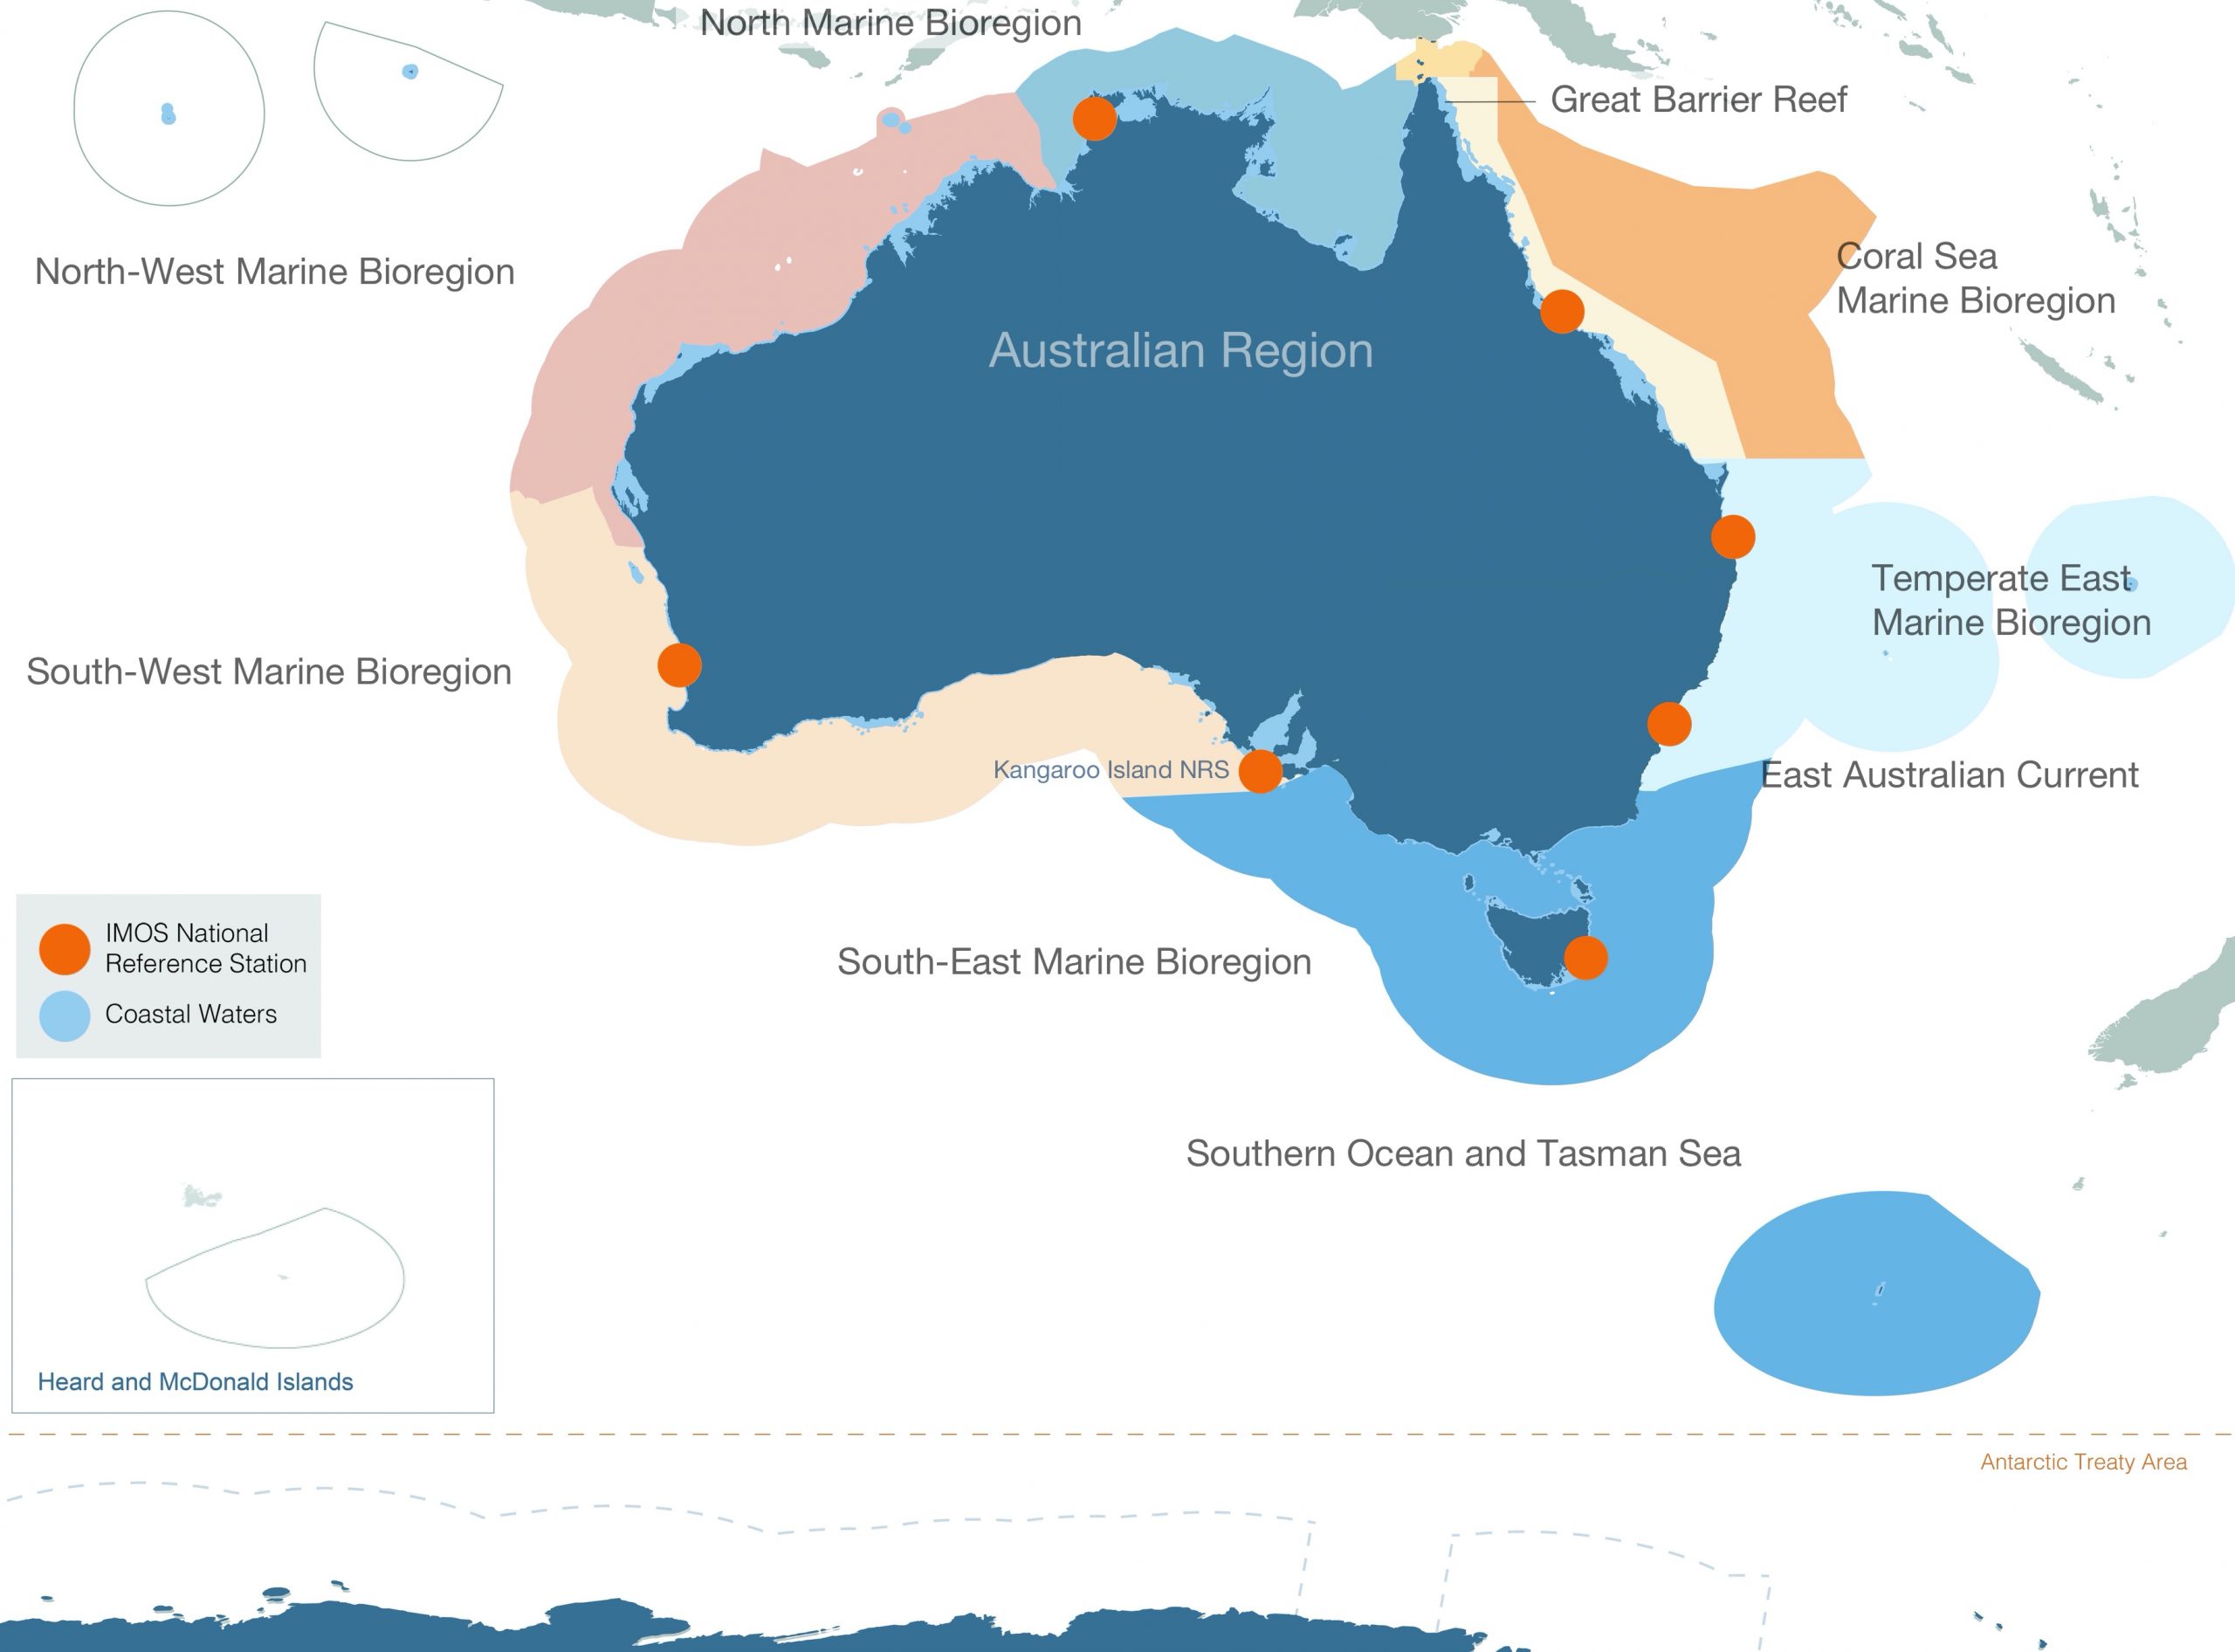
You can download a version of this map by clicking here, or on the image to the right.

Australia's Marine Bioregions
Australia’s ocean territory has been classified into six marine bioregions – South-east, Temperate East, South-west, North-west, North and Coral Sea. Marine bioregional plans have been developed by the Australian Government under the Environment Protection and Biodiversity Conservation Act 1999 (EPBC Act) to improve the way Australia’s oceans are managed so they remain healthy and productive.
You can access more information about marine bioregions on the State of the Environment 2016 website.


Australian Region
- Steady warming since 1920, particularly in the south (Time Series 1.1)
- The Leeuwin and East Australian Currents demonstrated strong seasonable and inter-annual variability linked to El Niño and La Niña events (Time Series 1.4)
- Large decreases in both aragonite saturation rate and pH between 1870-99 and 2000-09 (Time Series 1.6)
- Low average Chlorophyll a (0.25 mg m3) typical of healthy tropical/sub-tropical oceans. The average is declining, by 8% in the period 2003-19 (Time Series 2.1)
- Low average net primary production (551 mg C m-2 d-1) typical of healthy tropical/sub-tropical oceans. Average declining by 12% in the period 2002-2019 (Time Series 2.2)
- Seasonal cycle of phytoplankton follows latitudinal bands, except in the Leeuwin Current and northeast Indian Ocean (Time Series 2.4)
- Deep chlorophyll maxima deeper than mean mixed layer depths indicating that sub-surface production is important (Time Series 2.5)
- Average Secchi disk depth is 24m (Time Series 3.1)
- Majority of Tripos species exhibit broad temperature range (10-25°C). Restricted group of warm water species identified to enable monitoring of any future range expansion (Time Series 3.3)
- No evidence of decline in calcifying zooplankton at National Reference Stations (Time Series 4.4)

North Marine Bioregion
- Ocean warming (~0.74°C century-1) (Time Series 1.1)
- High Chlorophyll a (0.537 mg m-3) (Time Series 2.1)
- North bioregion had the greatest primary production at 324 gC m-2 y-1 (Time Series 2.2)
- Relatively high net primary production (888mg C m-2 d-1) (Time Series 2.2)
- Phytoplankton abundance declining at Darwin, but zooplankton abundance and biomass increasing (Time Series 2.3)
- Lowest water transparency and most opaque waters (Time Series 3.1)
- Modest increases in calcifier abundance (Time Series 4.4)

North-West Marine Bioregion
- Ocean warming (~0.6°C century-1) (Time Series 1.1)
- Many increases/decreases in mean monthly SST by up to 2°C at inter-annual scales, mainly associated with La Niña events (Time Series 1.2)
- Significant decline in Chlorophyll a from 2002-2019 (Time Series 2.1)
- Decline in net primary production (-10.2% (2002-2018)) (Time Series 2.2)

South-West Marine Bioregion
- Warming (~0.99°C century-1), with up to ~1.50°C century-1 at Rottnest Island (Time Series 1.1)
- At Rottnest Island there is no discernible trend in surface nitrate. Surface phosphorous and surface silicon are declining (Time Series 1.5)
- Decline in net primary production (8.6% (2003-18)) (Time Series 2.2)
- Phytoplankton biovolume declining at Rottnest Island, but zooplankton abundance increasing (Time Series 2.3)
- Unseasonal appearance of tropical Prochlorococcus at Rottnest Island during 2011-2012 marine heatwave (Time Series 2.6)
- High water transparency (Time Series 3.1)
- The 2011 WA marine heatwave led to a substantial decline in zooplankton biomass, abundance and size, and an increase in diversity at Rottnest Island (Time Series 4.2)

South-East Marine Bioregion
- Fast warming (~1.1°C century-1) with up to ~2°C at Maria Island, Tasmania (Time Series 1.1)
- At Maria Island, surface nitrate is rising, contrary to warming trend, and due to winter mixing and incursion of sub-Antarctic surface waters; surface phosphorous and surface silicon is declining (Time Series 1.5)
- Relatively low net primary production (423 mg C m-2 d-1) (Time Series 2.2)
- Zooplankton abundance and biomass increasing at Maria Island (Time Series 2.3)
- Summer peaks of tropical Prochlorococcus and sub-tropical Synechococcus at Maria Island indicate prolonged exposure to warmer waters via EAC extension (Time Series 2.6)
- Low water transparency (Time Series 3.1)
- Presence of warm-water Tripos paradoxides increases in winter (Time Series 3.3)
- Abundance of HABs is typically below trigger levels, with some exceptions. There is however evidence that abundance is increasing (Time Series 3.4)
- Range expansion of Noctiluca scintillans into Tasmania (1994) and the Southern Ocean (2010, 2013) (Time Series 3.6)
- Warm water copepod species increased in abundance at Maria Island, while cold water species decreased (Time Series 4.1)
- Some evidence that calcifying zooplankton may be sensitive to falling aragonite saturation (Time Series 4.4)
- North/south shift in latitudinal trend of larval fish assemblages below 35°S (Time Series 4.6)

Temperate East Marine Bioregion
- Fast warming (~0.93°C century-1), with up to ~1.50 °C century-1 at Port Hacking (Time Series 1.1)
- Linear increase in sea surface temperature along the east coast over 1993-2016 (Time Series 1.2)
- At Port Hacking, surface nitrate is declining - consistent with warming trends and is increasing at depth due to stratification. Surface phosphorous and surface silicon are declining (Time Series 1.5)
- Decline in net primary production (12.9% (2003-2018)) (Time Series 2.2)
- Phytoplankton biovolume and abundance declining significantly at North Stradbroke Island and Port Hacking, and zooplankton biomass declining at North Stradbroke Island (Time Series 2.3)
- Molecular data suggest that strains of Synechococcus increase in abundance and those of Prochlorococcus decrease in response to coastal upwelling at Port Hacking (Time Series 2.7)
- High water transparency. Validated by North Stradbroke Island NRS (Time Series 3.1)
- Significant decline in abundance of Trichodesmium at North Stradbroke Island (Time Series 3.2)
- Abundance of HABs is typically below trigger levels, with some exceptions. There is, however, evidence that abundance is increasing (Time Series 3.4)
- Harmful algal blooms on NSW beaches are seasonal and episodic nature (Time Series 3.5)
- Warm water copepod species increased in abundance at Port Hacking, cold water species decreased (Time Series 4.1)
- North/south shift in latitudinal trend of larval fish assemblages below 35°S (Time Series 4.6)

Coral Sea Marine Bioregion
- Warming (~0.8°C century-1) (Time Series 1.1)
- Low Chlorophyll a (0.084 mg m3) (Time Series 2.1)
- Decline in net primary production (9.1% (2003-2018)) (Time Series 2.2)
- Highest water transparency (Time Series 3.1)
Regional Observations

Great Barrier Reef
- Prochlorococcus most abundant at Yongala in spring and summer, then decline rapidly with drop in salinity due to seasonal rainfall (Time Series 2.6)
- Increase in abundance of Trichodesmium at Yongala (Time Series 3.2)
- Some evidence that calcifying zooplankton may be sensitive to falling aragonite saturation (Time Series 4.4)
- Previously unknown migration of Bull Sharks between NSW and the Great Barrier Reef revealed by the IMOS continental scale acoustic telemetry network (Time Series 4.7)

East Australia Current
- Considerable variability dominated by movement of the EAC on and offshore. Eastward displacement every 65-100 days associated with eddy shedding (Time Series 1.3)
- The copepod composition index is positive related to trends in sea surface temperature anomaly (2010-2018) (Time Series 4.3)

Kangaroo Island National Reference Station
- Inter-annual variability at Kangaroo Island driven by variability in Leeuwin and Flinders Currents associated with El Niño-Southern Oscillation (Time Series 1.6)
- Phytoplankton biovolume and abundance declining significantly at Kangaroo Island, but Zooplankton abundance and biomass increasing (Time Series 2.3)
- Euphotic depth is 41m deeper than mean mixed layer depth, pointing to a large volume of sub-surface water in which irradiances are high enough for photosynthesis (Time Series 2.5)

Southern Ocean and Tasman Sea
- Increasing trend in acoustic backscatter in Southern Ocean (77% (2010-2018)) and Tasman Sea (44-105%), likely to reflect change in mesopelagic communities (Time Series 4.5)
- IMOS satellite tagging of elephant seals in the Southern Ocean revealing physical drives of population change (Time Series 4.8)
Download the State and Trends of Australia's Ocean Report
Citing the report:
Richardson A.J, Eriksen R, Moltmann T, Hodgson-Johnston I, Wallis J.R. (2020). State and Trends of Australia’s Ocean Report, Integrated Marine Observing System (IMOS).

Citing the Report
Richardson A.J, Eriksen R, Moltmann T, Hodgson-Johnston I, Wallis J.R. (2020). State and Trends of Australia’s Ocean Report, Integrated Marine Observing System (IMOS).
The State and Trends of Australia's Ocean Report was supported by IMOS. IMOS gratefully acknowledges the additional support provided by the Commonwealth Scientific and Industrial Research Organisation (CSIRO).
The State and Trends of Australia's Ocean website is maintained by IMOS.

Australia’s Integrated Marine Observing System (IMOS) is enabled by the National Collaborative Research Infrastructure Strategy (NCRIS). It is operated by a consortium of institutions as an unincorporated joint venture, with the University of Tasmania as Lead Agent.
Disclaimer:
You accept all risks and responsibility for losses, damages, costs and other consequences resulting directly or indirectly from using this site and any information or material available from it. While the Integrated Marine Observing System (IMOS) has taken reasonable steps to ensure that the information on this website and related publication is correct, it provides no warranty or guarantee that information provided by the authors is accurate, complete or up-to-date. IMOS does not accept any responsibility or liability for any actions taken as a result of, or in reliance on, information on its website or publication. Users should check with the originating authors to confirm the accuracy of the information before taking any action in reliance on that information.
If you believe any information on this website or in the related publication is inaccurate, out of date or misleading, please bring it to our attention by contacting the authors directly or emailing us at IMOS@imos.org.au
Images and Information:
All information on this website remains the property of those who authored it. All images on this website are licensed through Adobe Stock, Shutterstock, or have permission from the original owner.