Biological Time Series - Productivity

2.5

Indicators of depth layers important to phytoplankton production

Contributors

Paul van Ruth1

Ana Redondo Rodriguez1

Claire Davies2

Anthony J. Richardson3,4

1 Aquatic Science Centre, South Australia Research and Development Institute, SA, Australia
2 CSIRO Oceans and Atmosphere, Hobart, TAS, Australia
3 CSIRO Oceans and Atmosphere, Queensland Biosciences Precinct (QBP), St Lucia, QLD, Australia
4 Centre for Applications in Natural Resource Mathematics (CARM), School of Mathematics and Physics, The University of Queensland, St Lucia, QLD, Australia

Key Information

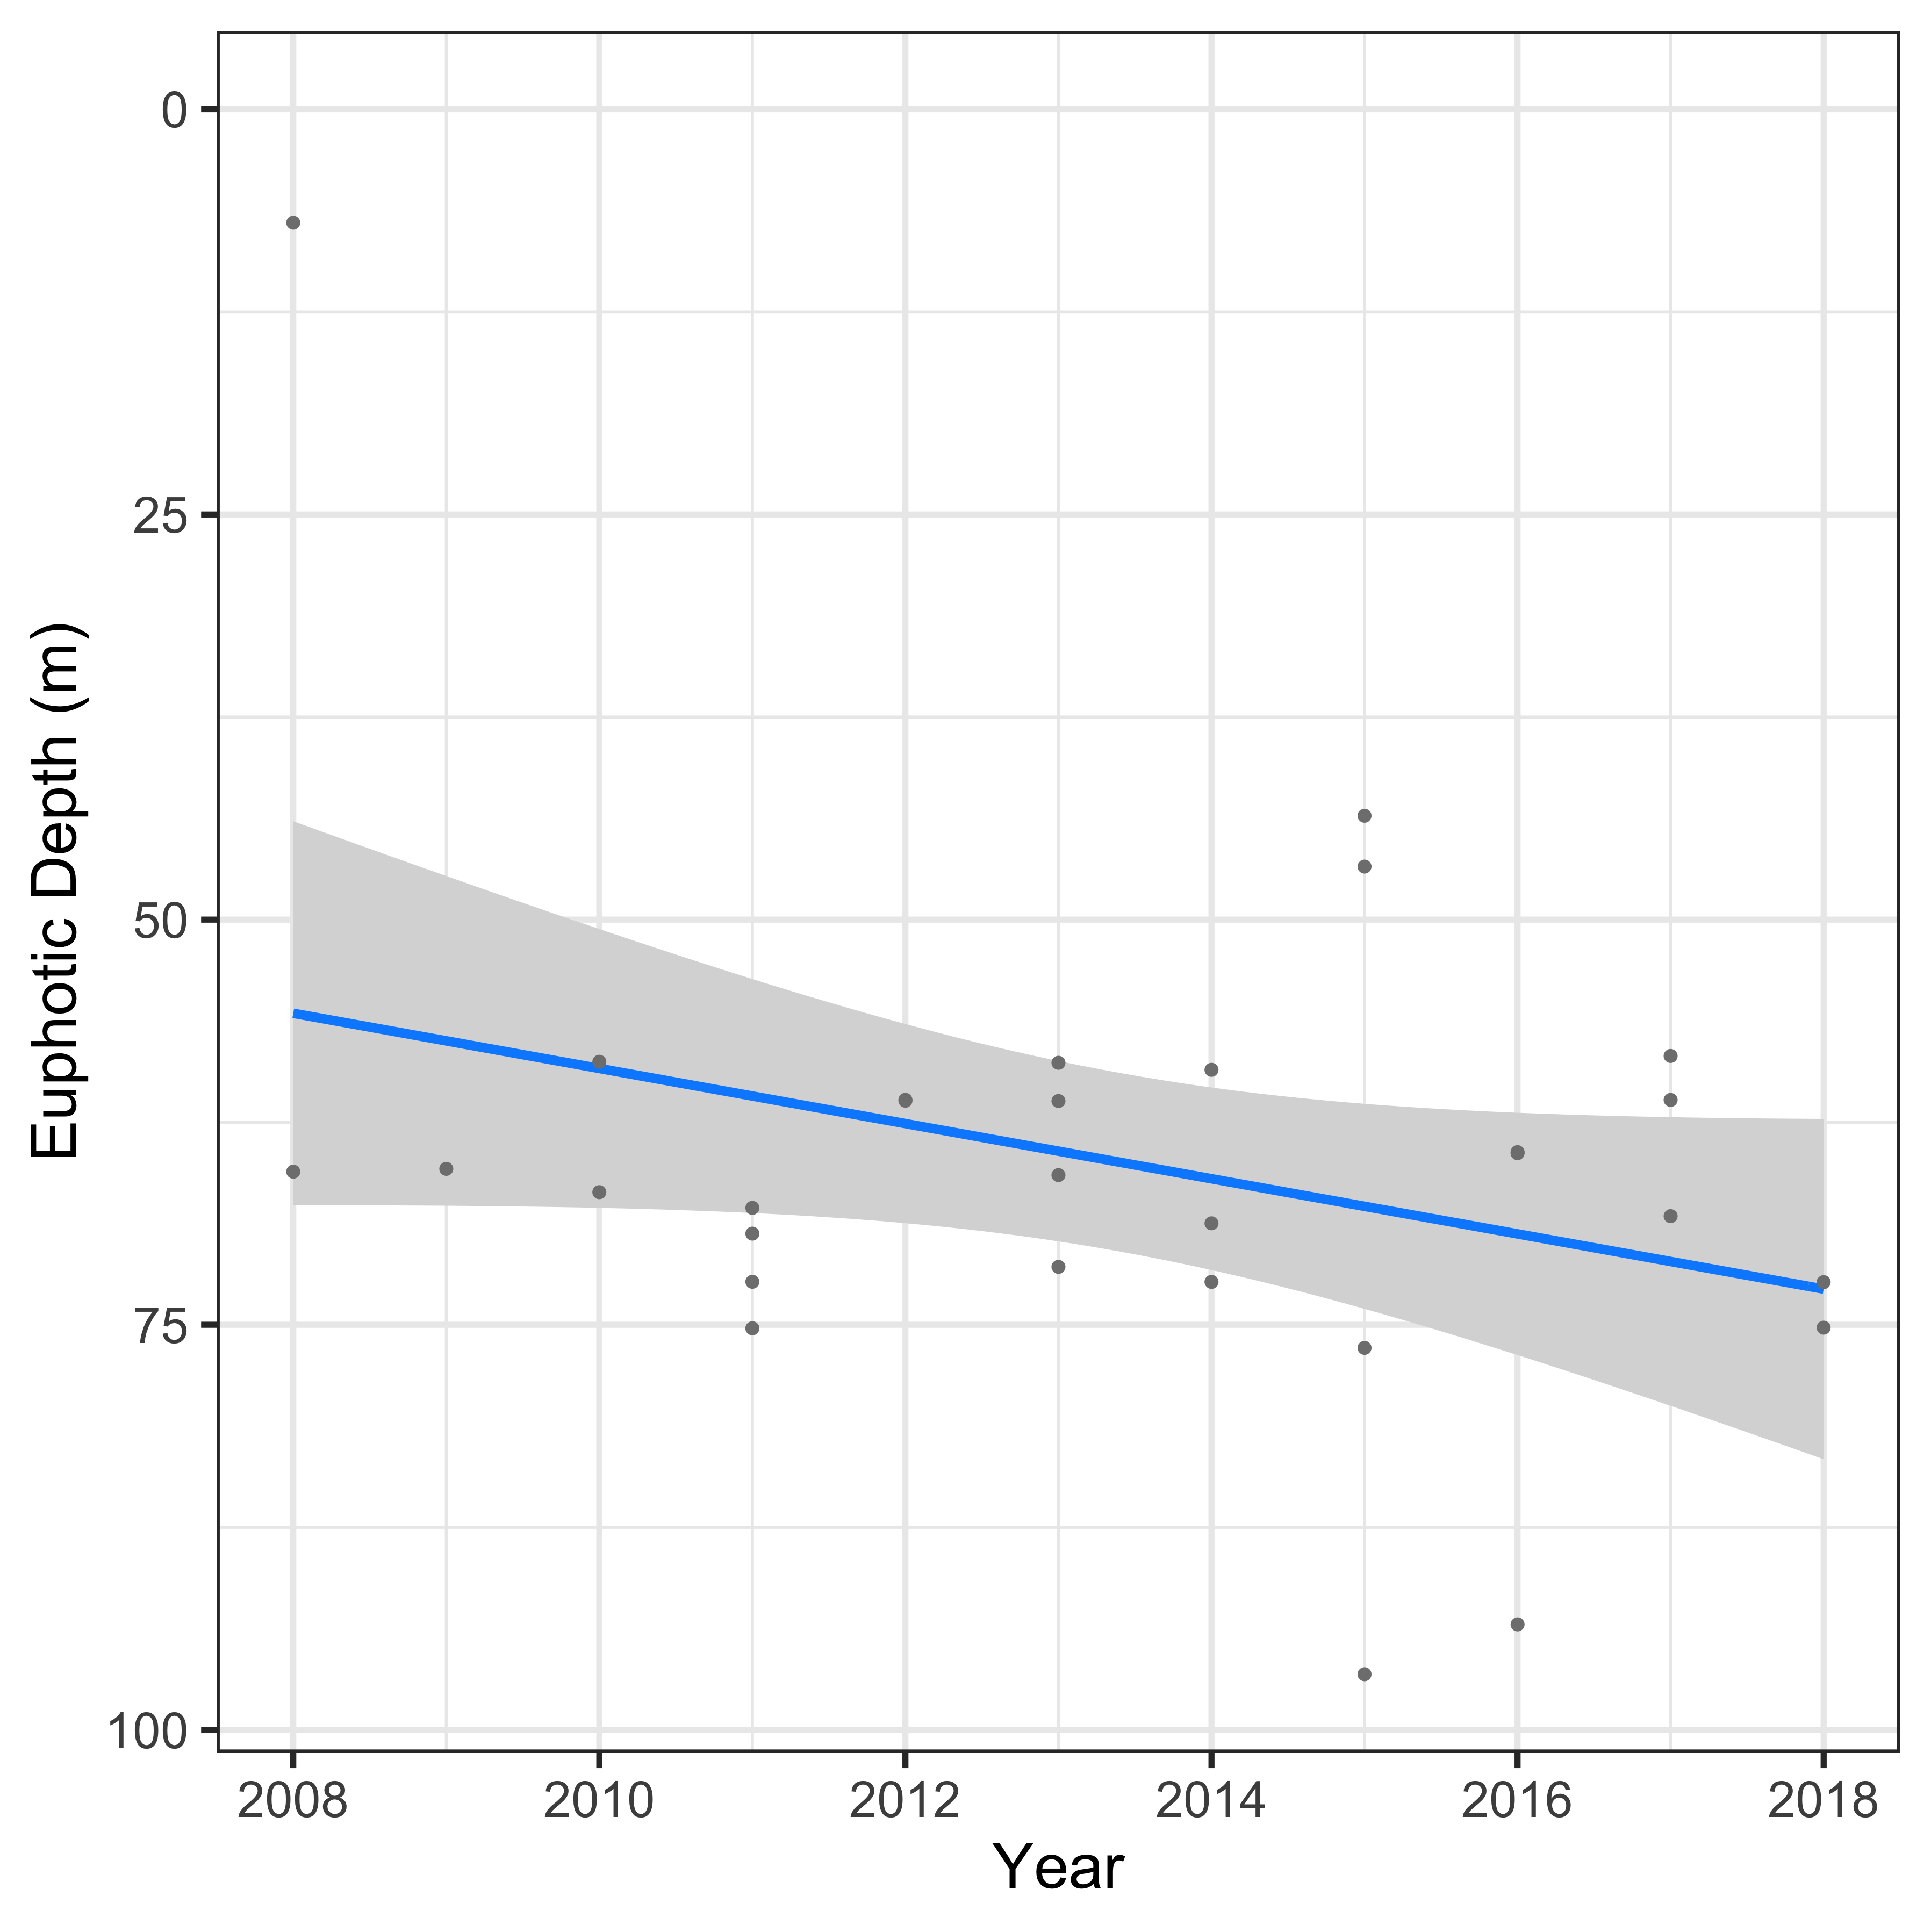
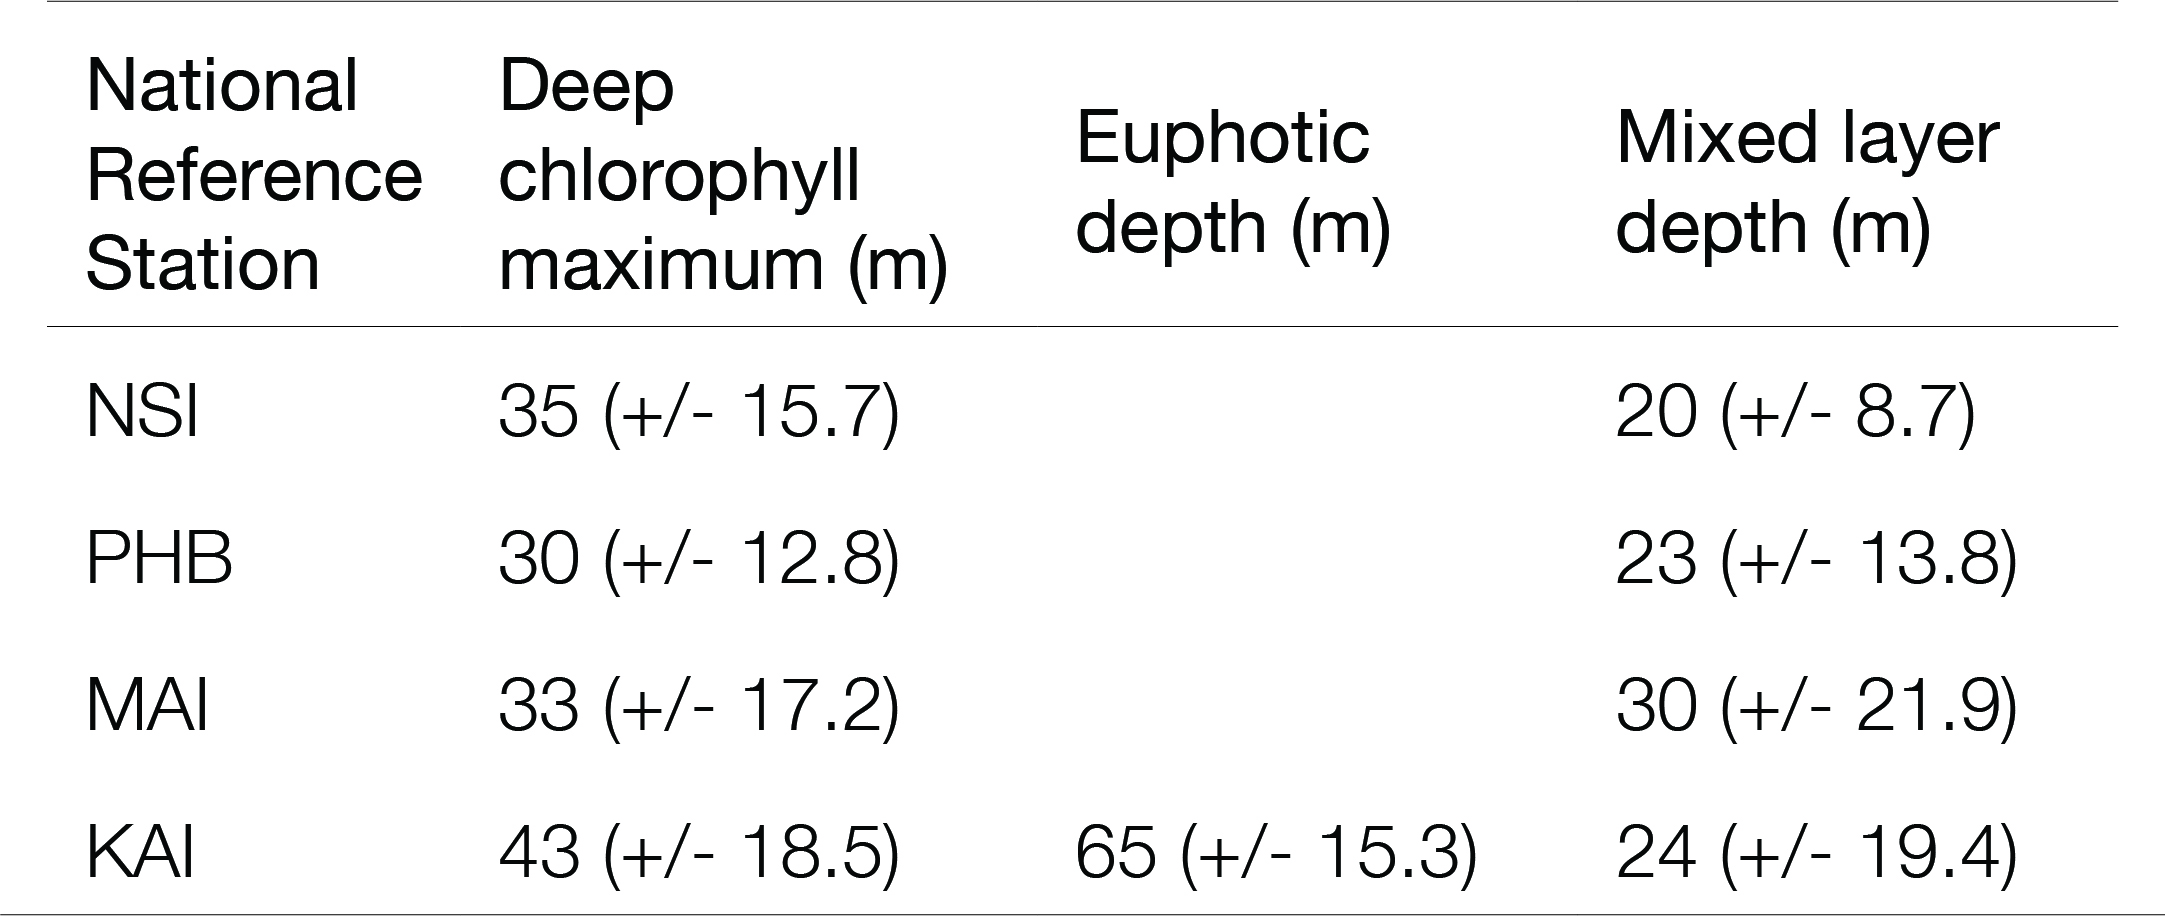
Monthly climatologies of mixed layer depth, euphotic depth, and the depth of the chlorophyll maximum highlight the importance of subsurface production to total water column productivity at outer-shelf IMOS National Reference Stations. Trends in the time-series data at these sites reveal changes in these depth layers that are indicative of strengthening turbulent mixing processes, increased solar intensities, and shifts in enrichment pathways, which have implications for primary production and total ecosystem productivity.

Keywords

turbulent mixing, solar intensity, enrichment pathways

Indicators of depth layers important to phytoplankton production

Production by phytoplankton – the rate of growth at the base of the open ocean food web – ultimately controls the abundance of higher trophic levels including fish, marine mammals and seabirds. Phytoplankton are microscopic plants, which produce food for higher trophic levels via photosynthesis. Critical to this process is the availability of nutrients and light. Mixing processes such as upwelling and vertical mixing promote phytoplankton productivity by bringing nutrients from great depths into well-lit surface waters where they can be used in photosynthesis. Mixing processes, however, can also influence the amount of light available for photosynthesis. During periods of strong/deep mixing, phytoplankton may spend significant periods in waters where irradiances are too low for photosynthesis to proceed. There are several layers in the ocean that together regulate phytoplankton production. The first is the depth of the mixed layer, the depth to which active turbulence from winds and tides homogenises the top layer of the ocean. The deeper it is, the deeper that phytoplankton are mixed, which will take them away from the light required for photosynthesis. A second depth layer is the euphotic zone, which is the layer from the surface to the depth at which irradiances are 1% of the surface irradiance. The deeper the euphotic depth, the deeper the layer in which photosynthesis and phytoplankton production can occur. A third important depth is that of the chlorophyll maximum, which is the depth of maximum phytoplankton biomass. The deeper the chlorophyll maximum, the less light phytoplankton will generally receive, and growth will be slower. However, phytoplankton are then closer to the nutrient-rich bottom-water and can often migrate to use it.

The interplay between mixed layer depth (MLD), the euphotic depth (Zeu), and the depth of the chlorophyll maximum (DCM) regulates primary production. The proximity of the depth of the chlorophyll maximum, relative to the mixed layer depth and the euphotic depth, reflects the importance of processes in the surface mixed layer to water column primary production, and may be indicative of changes in nutrient supply processes from surface sources (e.g., terrestrial run-off, surface flows) to more oceanic (e.g. upwelling/uplift/vertical mixing).

Information regarding the depth of the chlorophyll maximum is particularly important because satellites only see near-surface layers (to the optical depth of the satellite (Behrenfeld & Falkowski, 1997)). However, deep chlorophyll biomass (i.e., biomass below the surface mixed layer) contributes significantly to depth integrated primary production in many regions, such as the eastern Great Australian Bight (van Ruth, Ganf, & Ward, 2010a, 2010b; van Ruth et al., 2018). A better understanding of long-term trends in, and the climatology of, mixed layer depth, euphotic depth, and deep chlorophyll maxima will help improve modelled estimates of primary production. It will also help facilitate an accurate assessment of long-term trends in total water column primary production at IMOS National Reference Stations.

We examined variation in ecologically relevant depth layers using a decade (2008 – 2018) of profiling data collected from the five outer-shelf IMOS National Reference Stations (North Stradbroke Island, Port Hacking, Maria Island, Kangaroo Island, Rottnest Island) using conductivity, temperature, depth recorders (CTDs) fitted with fluorometers. Data from more coastal National Reference Stations (Darwin Harbour, Yongala) were not included in the analysis, since the shallow water depths characteristic of these sites resulted in mixed layer and euphotic depths regularly extending to the seafloor.

All data were processed according to standard IMOS procedures using the CTD Toolbox produced by the Australian Ocean Data Network. The deep chlorophyll maximum was the depth of the fluorescence maximum from each CTD profile. Mixed layer depths were calculated using potential density depth profiles according to the hybrid method modified from the algorithm of Holte and Talley (2009). This method calculates a number of possible mixed layer depths, based on a threshold, gradient or the shape of the profile, and then analyses the patterns to select a final depth estimate. Euphotic depth was calculated from profiles of photosynthetically active radiation, where available. The coefficient of downwelled irradiance (Kd) was derived from the slope of the semi-log plot of irradiance versus depth. Euphotic depth was calculated by substituting Kd into the Beer-Lambert equation (Kirk, 1994):

Zeu = 1/Kd x In(100/1) 

Monthly climatologies for each variable were produced by calculating monthly means from all observations across the time series at each site. Most sites have not collected light profiles, so euphotic depth could only be analysed for Kangaroo Island.

To examine longer-term changes in depths of the deep chlorophyll maximum, mixed layer depth and euphotic depth, we fitted linear models. For the deep chlorophyll maximum and mixed layer depth models (each was the response), predictors were Station (with five levels of National Reference Station: NSI, PHB, MAI, KAI, ROT), Year (as a linear trend), and Month (the seasonal cycle modelled as a harmonic of superimposed sine and cosine waves). We included the interaction of Station:Year, allowing different slopes for each Station. We also included the interaction of Station:Month, allowing different seasonal cycles for each Station. As euphotic depth was only available for KAI, we did not include the Station effect or its interactions. We visually inspected model residuals using diagnostic plots and observed that homogeneity of variance assumptions and normality were reasonably met for deep chlorophyll maximum and the euphotic depth, but residuals for the mixed layer depth increased with predicted values. We thus used a generalised linear model with a Gamma error structure with a log-link function, which improved the distribution of residuals in the diagnostic plots. 

There was a range of trends in the time series examined at the National Reference Stations (Figure 1). For all sites, mean deep chlorophyll maxima across the time series were deeper than mean mixed layer depths (Table 1). This suggests that sub-surface production, below the surface mixed layer, is an important component of integrated water column primary production at Integrated Marine Observing System (IMOS) National Reference Stations (NRS).

The irradiance data from KAI showed that the euphotic depth was 41 m deeper than the mean mixed layer depth (Table 1), which indicates that there was a large volume of water below the surface mixed layer in which irradiances were high enough for photosynthesis. During the characteristic summer/autumn upwelling at KAI, this water is likely to be rich in nutrients and promote substantial sub-surface primary production. This assertion is supported by the fact that the mean deep chlorophyll maximum at KAI is found in the bottom layer, mid-way between the mixed layer depth and the euphotic depth (Table 1).

Monthly climatologies highlighted differences in physical characteristics among sites. In general, mixed layers were shallower in summer, becoming deeper through autumn into winter (due to increased winter mixing), then shallower again through spring (Figure 2). However, this pattern was most pronounced at Maria Island and Kangaroo Island, and least evident at Rottnest Island.

Monthly euphotic depth at Kangaroo Island remained relatively constant, aside from an abrupt deepening in June that coincided with the shallowest deep chlorophyll maximum (Figure 2D). Euphotic depth ranged between 57.8 m in November and 96.6 m in June. The depth of the euphotic zone at Kangaroo Island was always deeper than the mixed layer, from 59.6 m deeper in June to 4.5 m deeper in July.

Deep chlorophyll maximum model

In the final linear model for the deep chlorophyll maximum, the interaction Station:Month and the main effect of Month, were not significant. The final model included the interaction Station:Year, indicating that trends over time in the deep chlorophyll maximum were variable among Stations (Figure 3). The deep chlorophyll maximum is deepening at both NSI (0.9 m yr-1) and MAI (1.02 m yr-1). By contrast, it is shallowing at PHB (0.16 m yr-1), KAI (1.50 m yr-1) and ROT (0.69 m yr-1). The deep chlorophyll maxima are between 30-35 m for all National Reference Stations, except for KAI, which is 41.9 m.

Mixed layer depth model

The final generalised linear model for the mixed layer depth at the National Reference Stations had non-significant interactions for Year:Station (implying the yearly trend was the same at all stations) and Month:Station (implying the seasonal cycles were the same at all stations) (Figure 4). The Year effect was marginally significant (p<0.058), and indicated that the mixed layer depth is deepening by 1.02 m yr-1 across all the National Reference Stations. MLDs were shallowest in autumn and spring. The mean mixed layer depths for the were 20-25 m for all stations, except MAI, which was 30.2 m (in June 2013).

Euphotic depth model

For the euphotic depth model Year was marginally significant (p<0.084), but Month was not significant. The Year effect showed that euphotic depth deepened at KAI by 1.70 m yr-1 (Figure 5).

An examination of long-term variation in water column integrated primary production – probably the best estimate of food available at lower trophic levels – requires an understanding of variations in depth layers relevant for phytoplankton. This information feeds directly into depth-integrated models of primary production.

Monthly climatologies presented here highlight the importance of subsurface production throughout the annual cycle at North Stradbroke Island and Rottnest Island, and through spring, summer and autumn at Port Hacking, Maria Island, and Kangaroo Island. Data from Kangaroo Island indicate that there is always (perhaps with the exception of July) a significant volume of water below the surface mixed layer that is still within the euphotic zone. This means that deeper nutrient-rich water still has sufficient light for photosynthesis. Consideration of the phytoplankton below the mixed layer and within the euphotic zone is critical for robust estimates of integrated water column production, particularly through the summer upwelling season, and the autumn and spring transitions to and from winter.

Trends in the time series data at the IMOS National Reference Stations suggest that turbulent mixing processes from winds and tides are getting stronger at all sites. The deepening trend in euphotic depths at Kangaroo Island imply that either the water column is becoming clearer, with less suspended matter, or solar irradiances are becoming more intense. Trends in the depth of the chlorophyll maximum may be indicative of changes in the influence of oceanic enrichment processes like upwelling, uplift and vertical mixing, which may be weakening at NSI and MAI, and strengthening at PHB, ROT, and more significantly at KAI. However, while generally due to increased biomass from photosynthesis, deep chlorophyll maxima may also be caused by an increase in phytoplankton chlorophyll content per cell in response to low irradiances (i.e. phytoplankton produce more of the light capturing pigment to enable them to capture as much light as possible when there is not much light available). This generally occurs at depths close to the euphotic depth (Kirk, 1994) . In the absence of irradiance data and euphotic depths at National Reference Stations other than Kangaroo Island, care must be taken in interpreting trends in the depth of the chlorophyll maximum.

While inferences can be made about probable euphotic depth from other available data, such as fluorescence (Lund-Hansen, 2004) or remotely-sensed data (Lee et al., 2007) , the lack of light profiles at NRS other than Kangaroo Island represents a significant gap in the IMOS dataset that should be filled. Light profiles in other regions would not only provide the data to make robust national comparisons of integrated primary production, but could assist in the validation of regional remote sensing algorithms.

Together, the trends highlighted in this analysis above have implications for primary production, and consequently ecosystem productivity. They also highlight the need for more in-depth, integrative analysis of IMOS time series, with careful consideration of the data streams and products required to best assist in the management of Australia’s marine resources.

Behrenfeld, M. J., & Falkowski, P. G. (1997). A consumer's guide to phytoplankton primary productivity models. Limnology and Oceanography, 42(7), 1479-1491. doi:10.4319/lo.1997.42.7.1479

Holte, J., & Talley, L. (2009). A new algorithm for finding mixed layer depths with applications to argo data and subantarctic mode water formation. Journal of Atmospheric and Oceanic Technology, 26(9), 1920-1939. doi:10.1175/2009jtecho543.1

Kirk, J. T. O. (1994). Light and photosynthesis in aquatic ecosystems. Cambridge: Cambridge University Press

Lee, Z., Weidemann, A., Kindle, J., Arnone, R., Carder, K. L., & Davis, C. (2007). Euphotic zone depth: Its derivation and implication to ocean-color remote sensing. Journal of Geophysical Research-Oceans, 112(C3). doi:10.1029/2006jc003802

Lund-Hansen, L. C. (2004). Diffuse attenuation coefficients K-d(PAR) at the estuarine North Sea-Baltic Sea transition: time-series, partitioning, absorption, and scattering. Estuarine Coastal and Shelf Science, 61(2), 251-259. doi:10.1016/j.ecss.2004.05.004

van Ruth, P. D., Ganf, G. G., & Ward, T. M. (2010a). Hot-spots of primary productivity: An Alternative interpretation to Conventional upwelling models. Estuarine Coastal and Shelf Science, 90(3), 142-158. doi:10.1016/j.ecss.2010.08.009

van Ruth, P. D., Ganf, G. G., & Ward, T. M. (2010b). The influence of mixing on primary productivity: A unique application of classical critical depth theory. Progress in Oceanography, 85(3-4), 224-235. doi:10.1016/j.pocean.2010.03.002

van Ruth, P. D., Patten, N. L., Doubell, M. J., Chapman, P., Rodriguez, A. R., & Middleton, J. F. (2018). Seasonal- and event-scale variations in upwelling, enrichment and primary productivity in the eastern Great Australian Bight. Deep Sea Research Part II: Topical Studies in Oceanography, 157-158, 36-45. doi: 10.1016/j.dsr2.2018.09.008

Figure 1

Time series for the depth of the chlorophyll (fluorescence) maximum, euphotic depth, and mixed layer depth at the five the five outer shelf NRS. Dashed lines indicate linear regressions through the data points for each variable.

Figure 2

Monthly climatologies (means ± standard deviation) for the depth of the chlorophyll (fluorescence) maximum, euphotic depth, and mixed layer depth at the five the five outer shelf NRS.

Figure 3

The final linear model for the Deep Chlorophyll Maximum (m) at the National Reference Stations. The interaction between Station and Year was significant. The Deep Chlorophyll Maximum is deepening at NSI and MAI, and shallowing at KAI and ROT, with little change at PHB.

Figure 4

The final linear model for the Mixed Layer Depth (m) at the National Reference Stations. The main effects Year, Month and Station were significant. The Mixed Layer Depth is deepening across the National Reference Stations.

Figure 5

The final linear model for the Euphotic Depth (m) at Kangaroo Island. The Euphotic Depth is deepening.

Table 1

Time series mean (± standard deviation) for ecologically relevant depth layers at IMOS NRS derived from CTD profile data collected between 2008 and 2018.

Download this Time Series Report

Citing this report: 

Van Ruth P, Redondo Rodriguez A, Davies C, Richardson A.J. (2020) Indicators of depth layers important to phytoplankton productivity. In Richardson A.J, Eriksen R, Moltmann T, Hodgson-Johnston I, Wallis J.R. (Eds). State and Trends of Australia’s Ocean Report. doi: 10.26198/5e16a98549e7d

doi: 10.26198/5e16a98549e7d

Access the Data

Access the data that contributes to this time-series by clicking the icons below

06f. National Reference stations-02

National Reference Stations

Citing the Report

Richardson A.J, Eriksen R, Moltmann T, Hodgson-Johnston I, Wallis J.R. (2020). State and Trends of Australia’s Ocean Report, Integrated Marine Observing System (IMOS).

IMOS_logo-stacked-reversed-01

The State and Trends of Australia's Ocean Report was supported by IMOS. IMOS gratefully acknowledges the additional support provided by the Commonwealth Scientific and Industrial Research Organisation (CSIRO).

The State and Trends of Australia's Ocean website is maintained by IMOS.


NCRIS-PROVIDER-REV

Australia’s Integrated Marine Observing System (IMOS) is enabled by the National Collaborative Research Infrastructure Strategy (NCRIS). It is operated by a consortium of institutions as an unincorporated joint venture, with the University of Tasmania as Lead Agent.

Disclaimer:

You accept all risks and responsibility for losses, damages, costs and other consequences resulting directly or indirectly from using this site and any information or material available from it. While the Integrated Marine Observing System (IMOS) has taken reasonable steps to ensure that the information on this website and related publication is correct, it provides no warranty or guarantee that information provided by the authors is accurate, complete or up-to-date. IMOS does not accept any responsibility or liability for any actions taken as a result of, or in reliance on, information on its website or publication. Users should check with the originating authors to confirm the accuracy of the information before taking any action in reliance on that information.

If you believe any information on this website or in the related publication is inaccurate, out of date or misleading, please bring it to our attention by contacting the authors directly or emailing us at IMOS@imos.org.au


Images and Information:

All information on this website remains the property of those who authored it. All images on this website are licensed through Adobe Stock, Shutterstock, or have permission from the original owner.