Biological Time Series - Water Quality

3.3

Tripos dinoflagellates as indicators of Australian marine bioregions

Contributors

Gustaaf Hallegraeff1

Claire Davies2

Ruth Eriksen2

1 Institute for Marine and Antarctic Studies, University of Tasmania, Hobart, TAS, Australia
2 CSIRO Oceans and Atmosphere, Hobart, TAS, Australia

Key Information

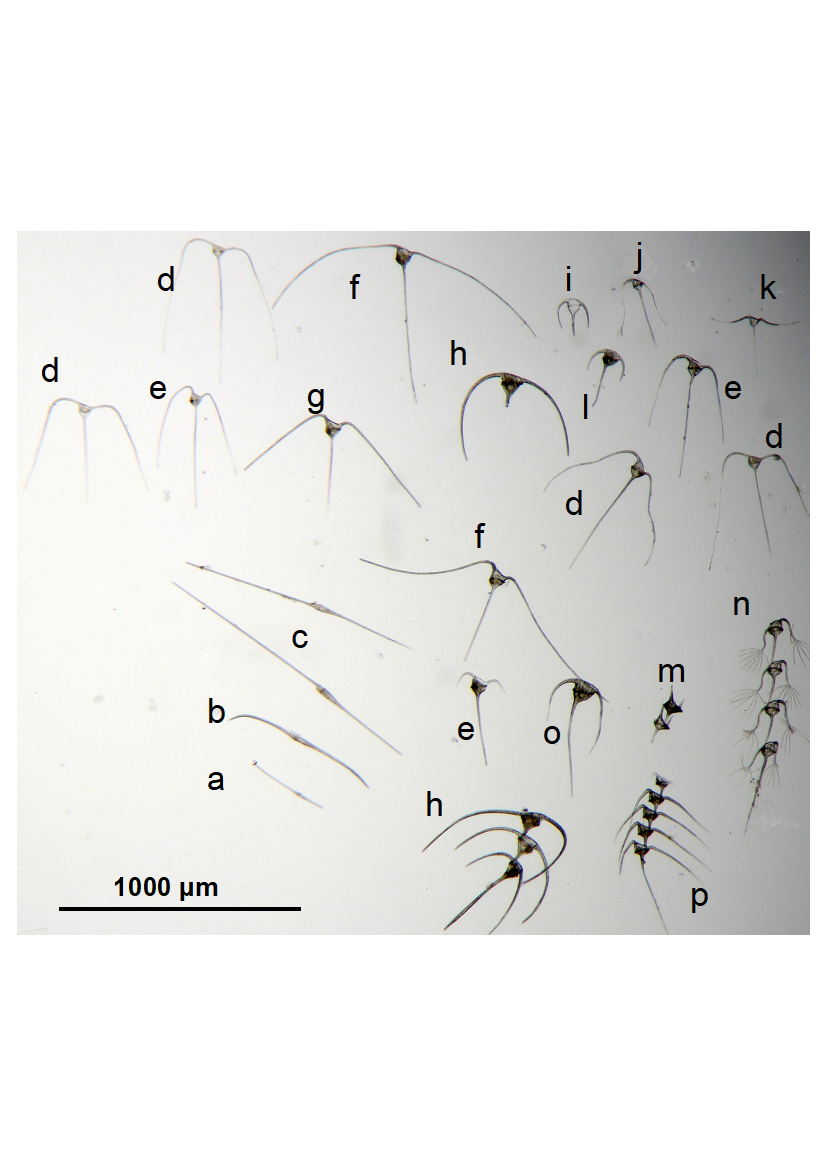
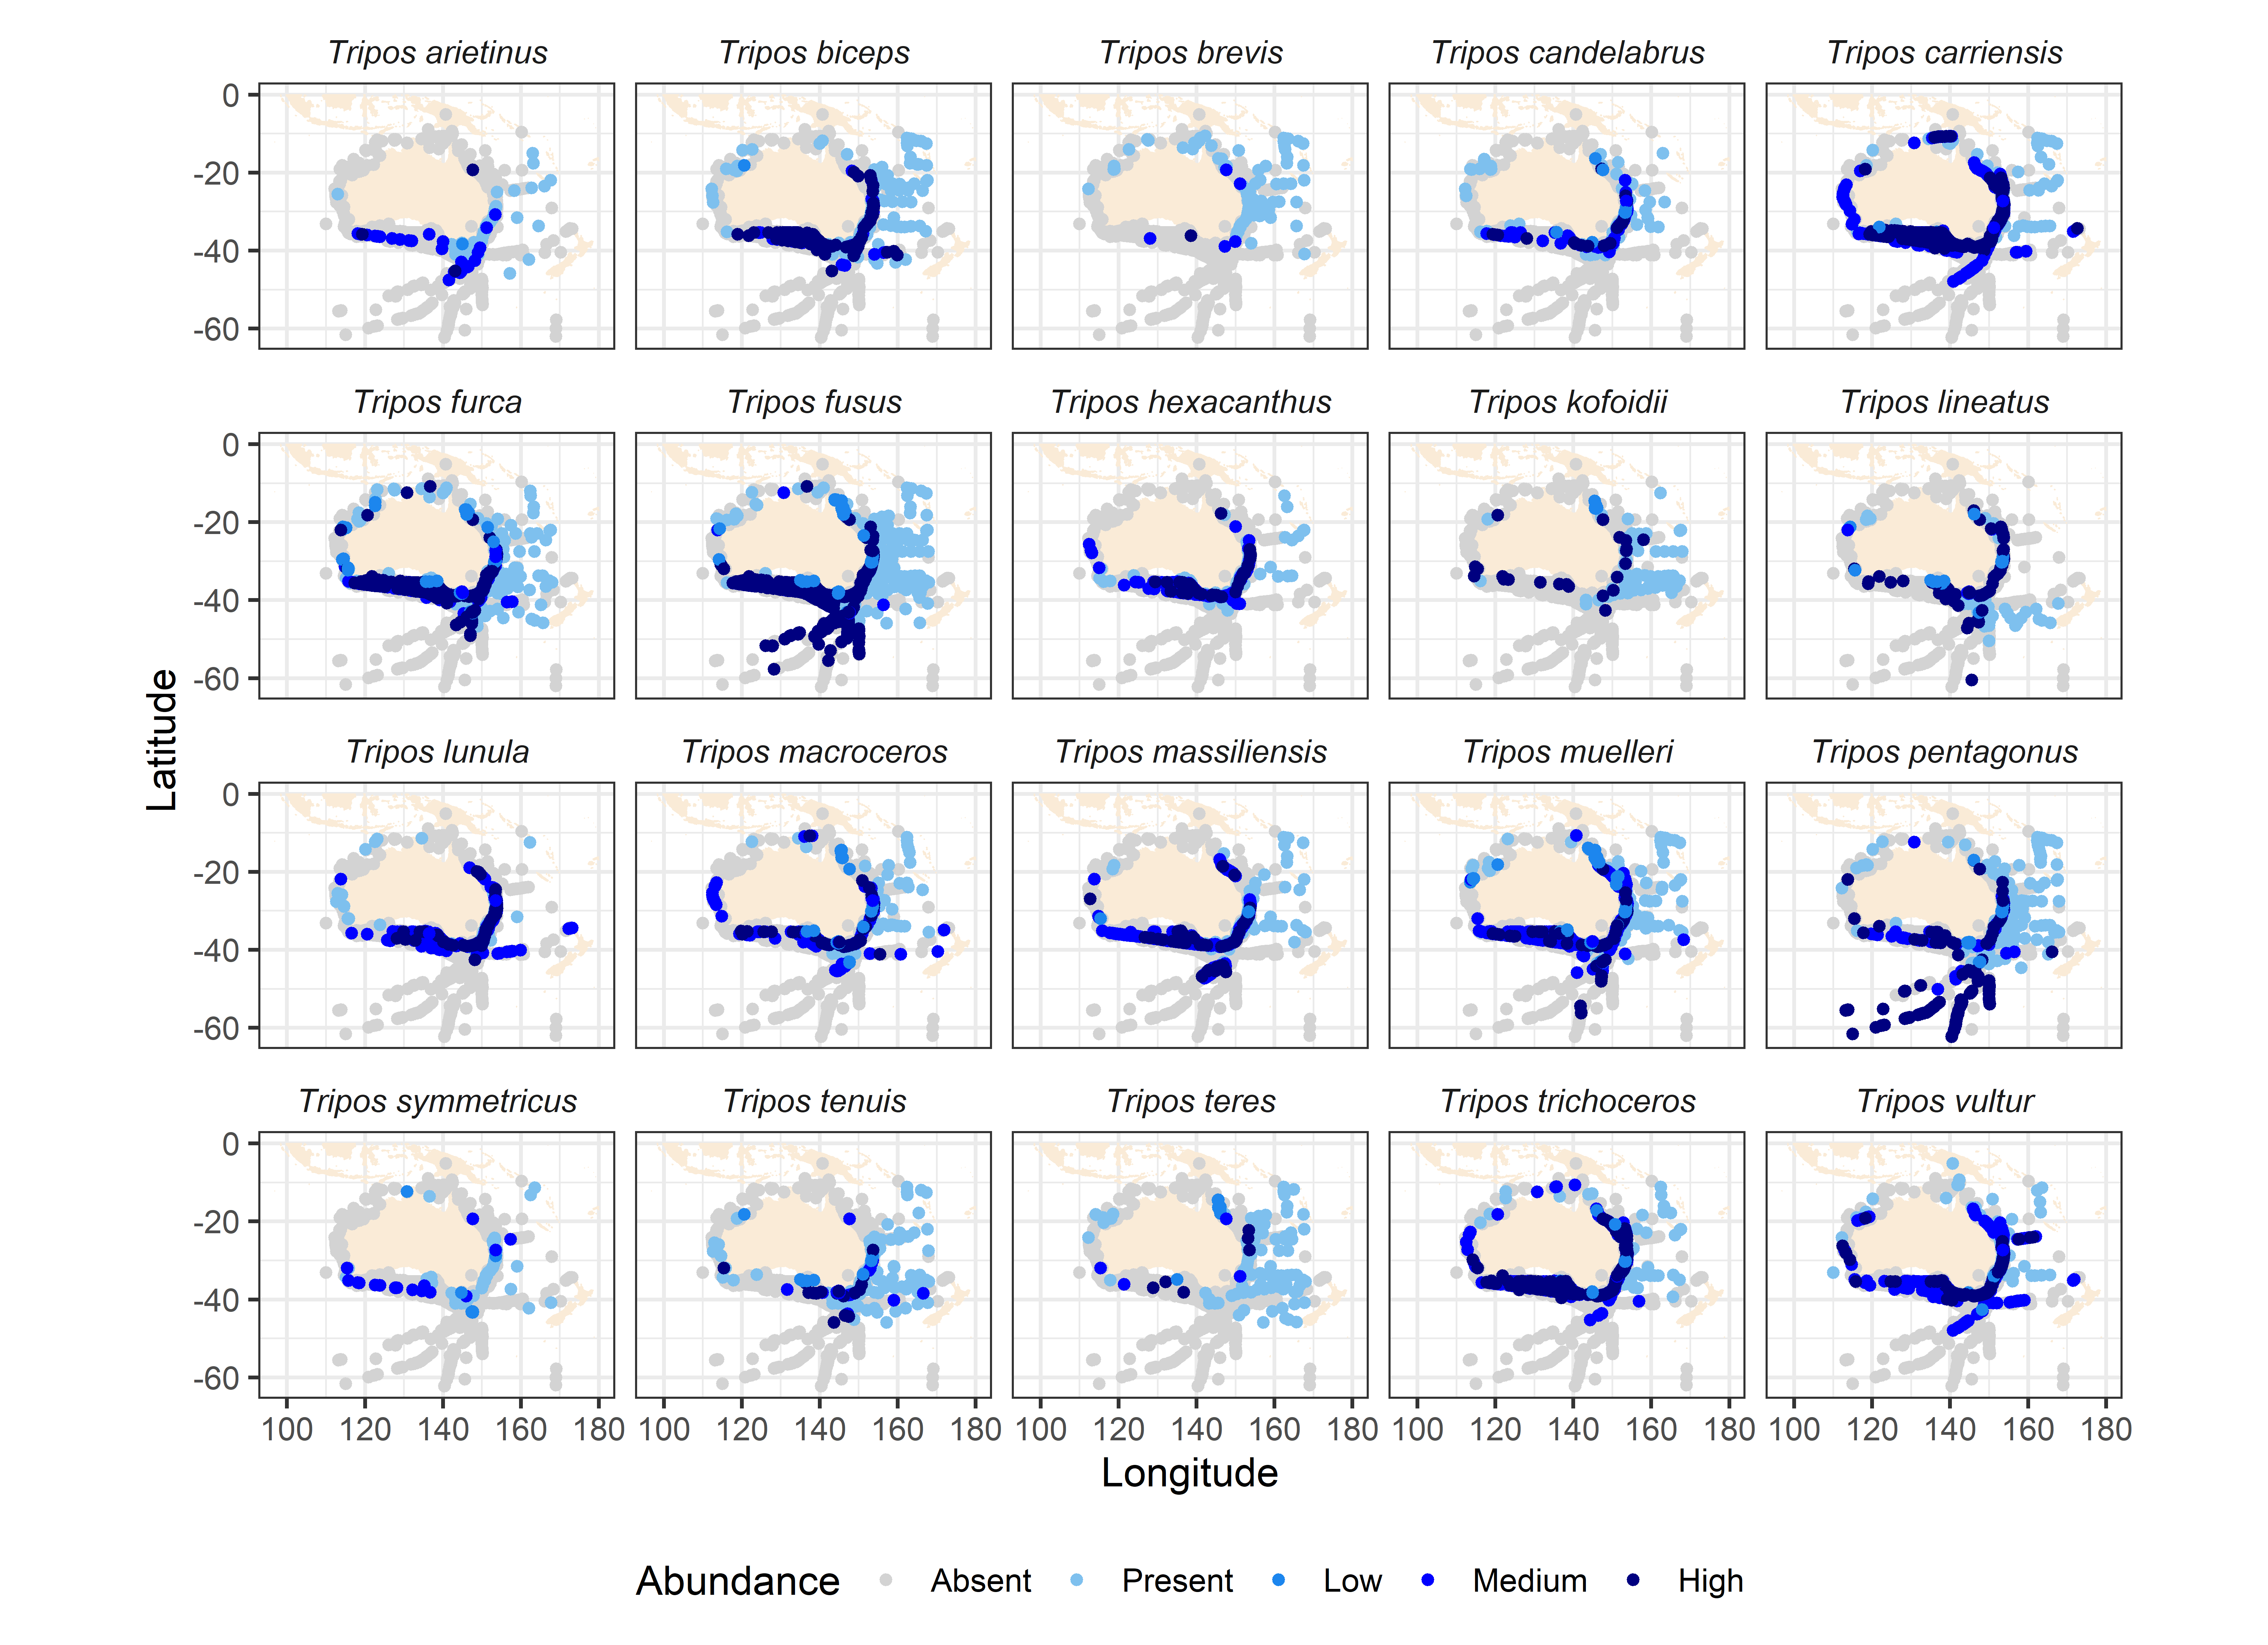
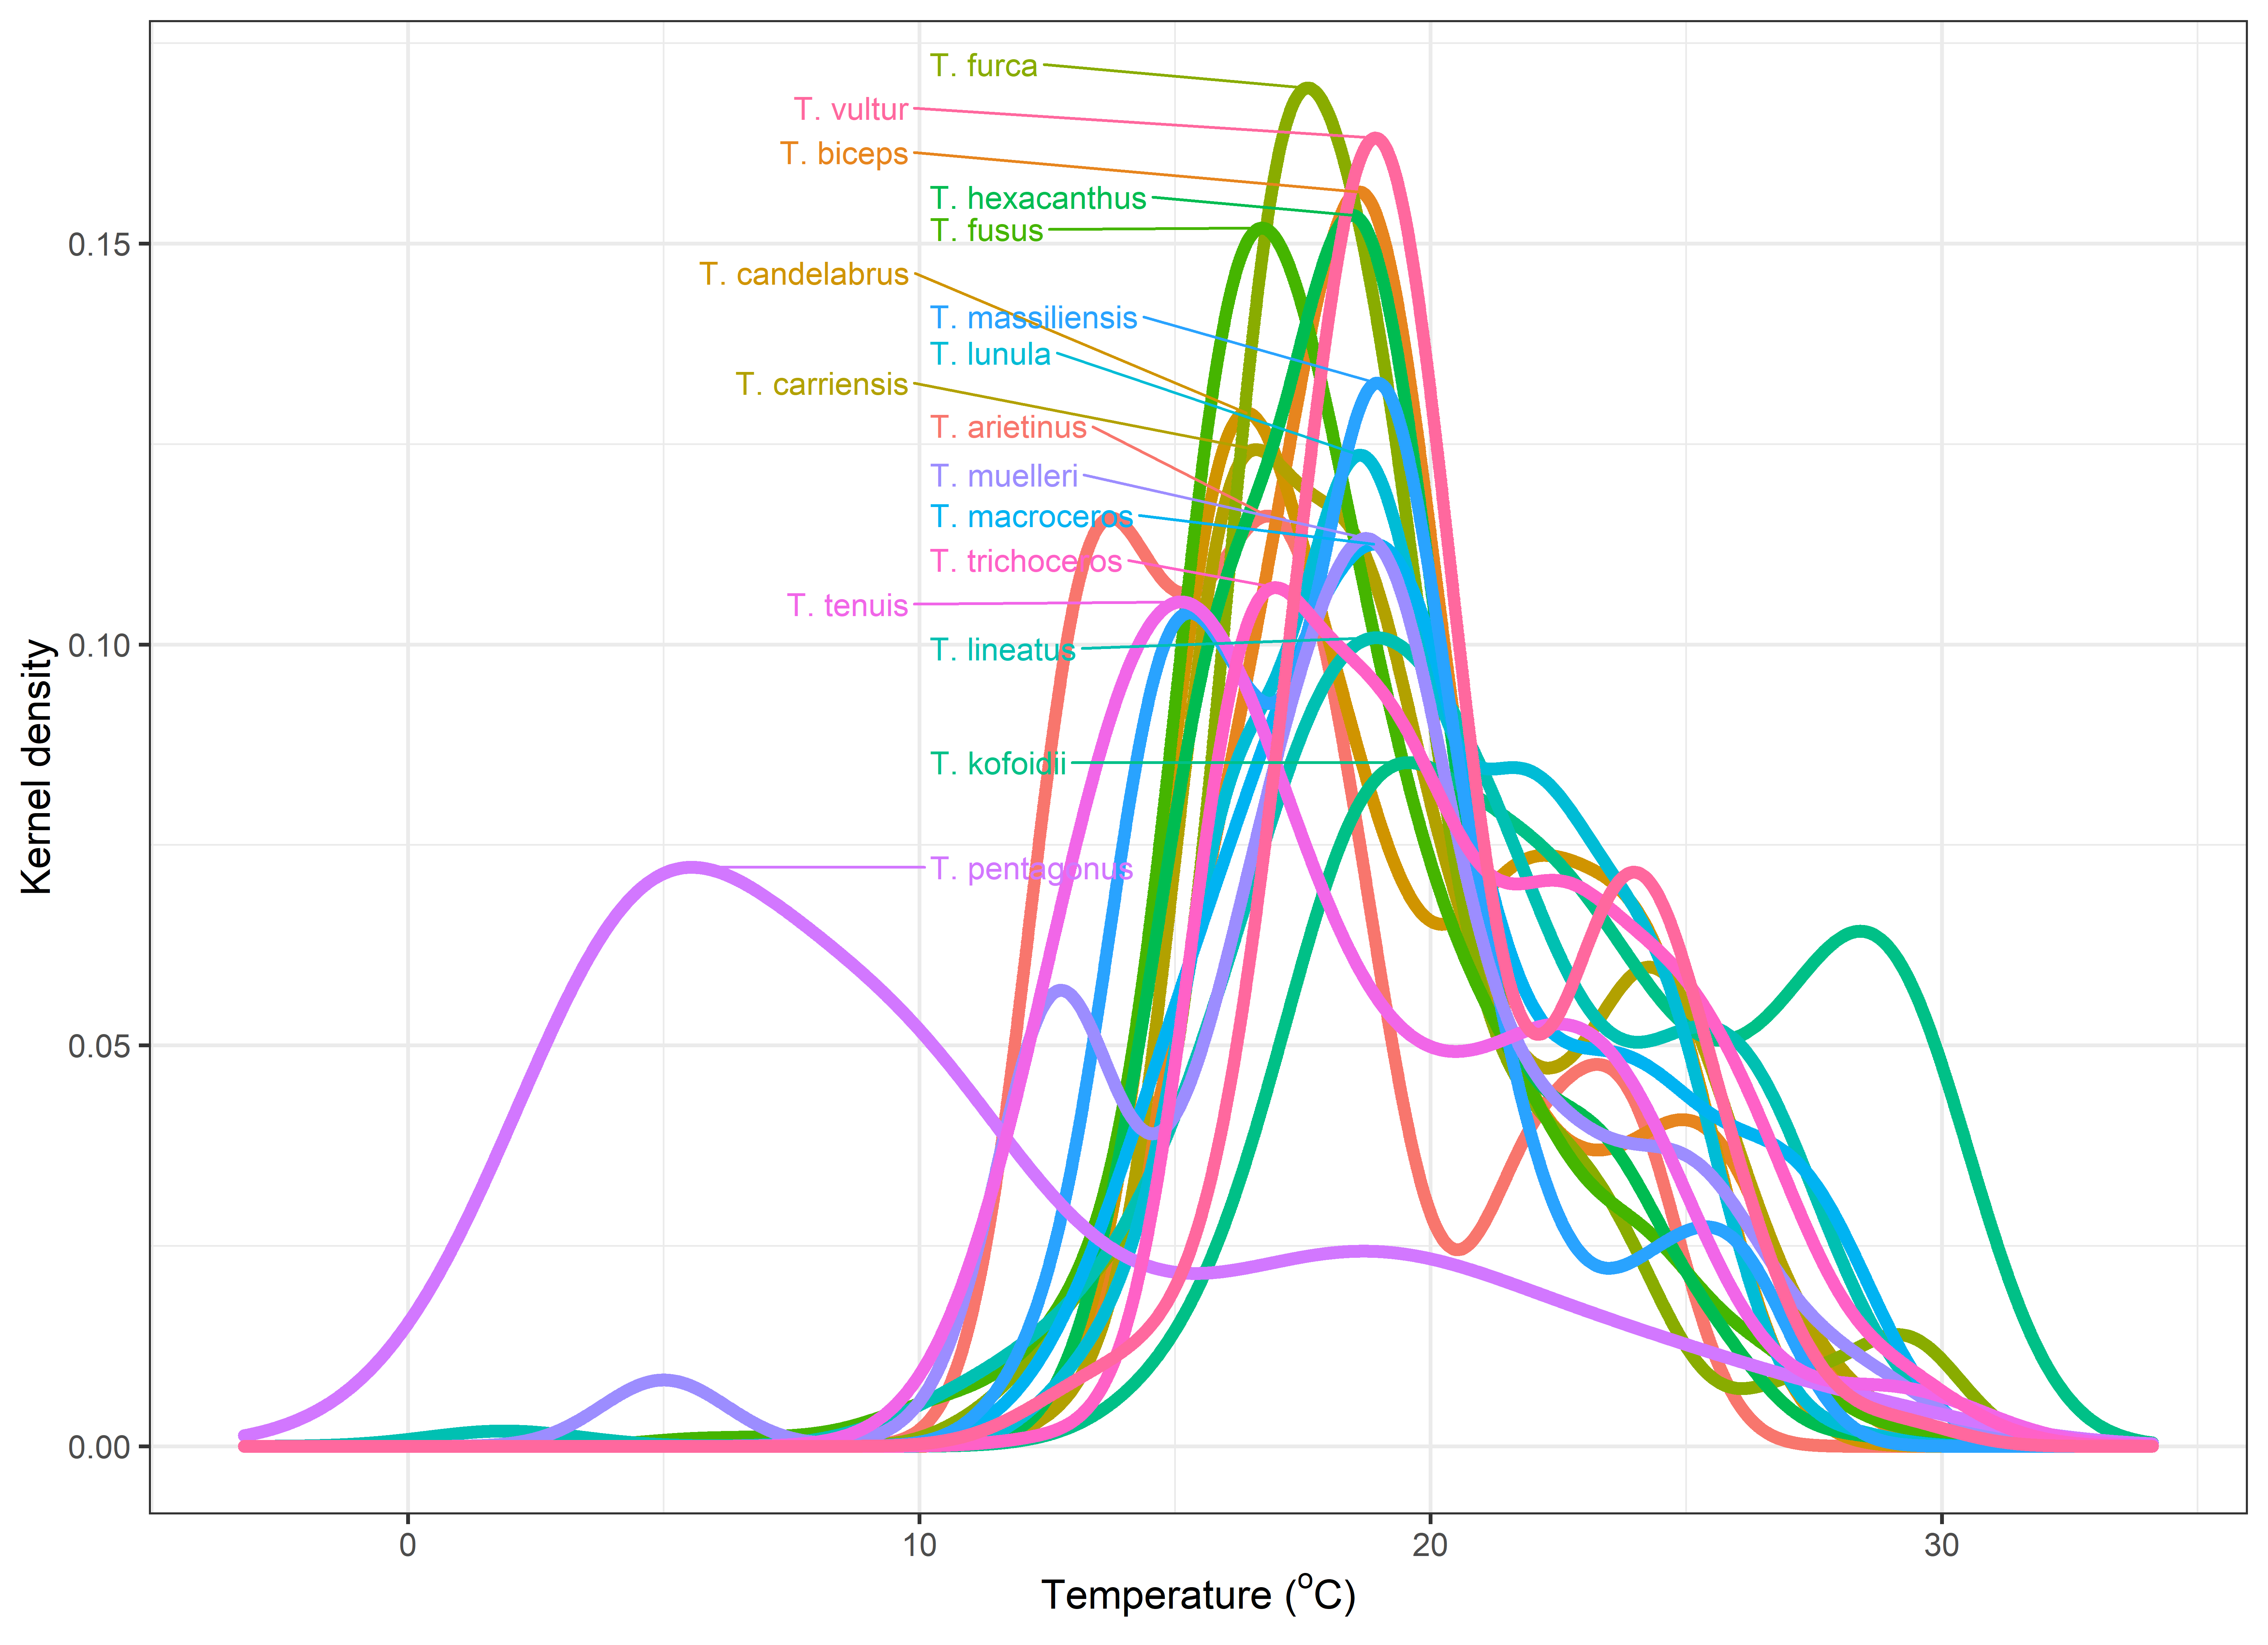
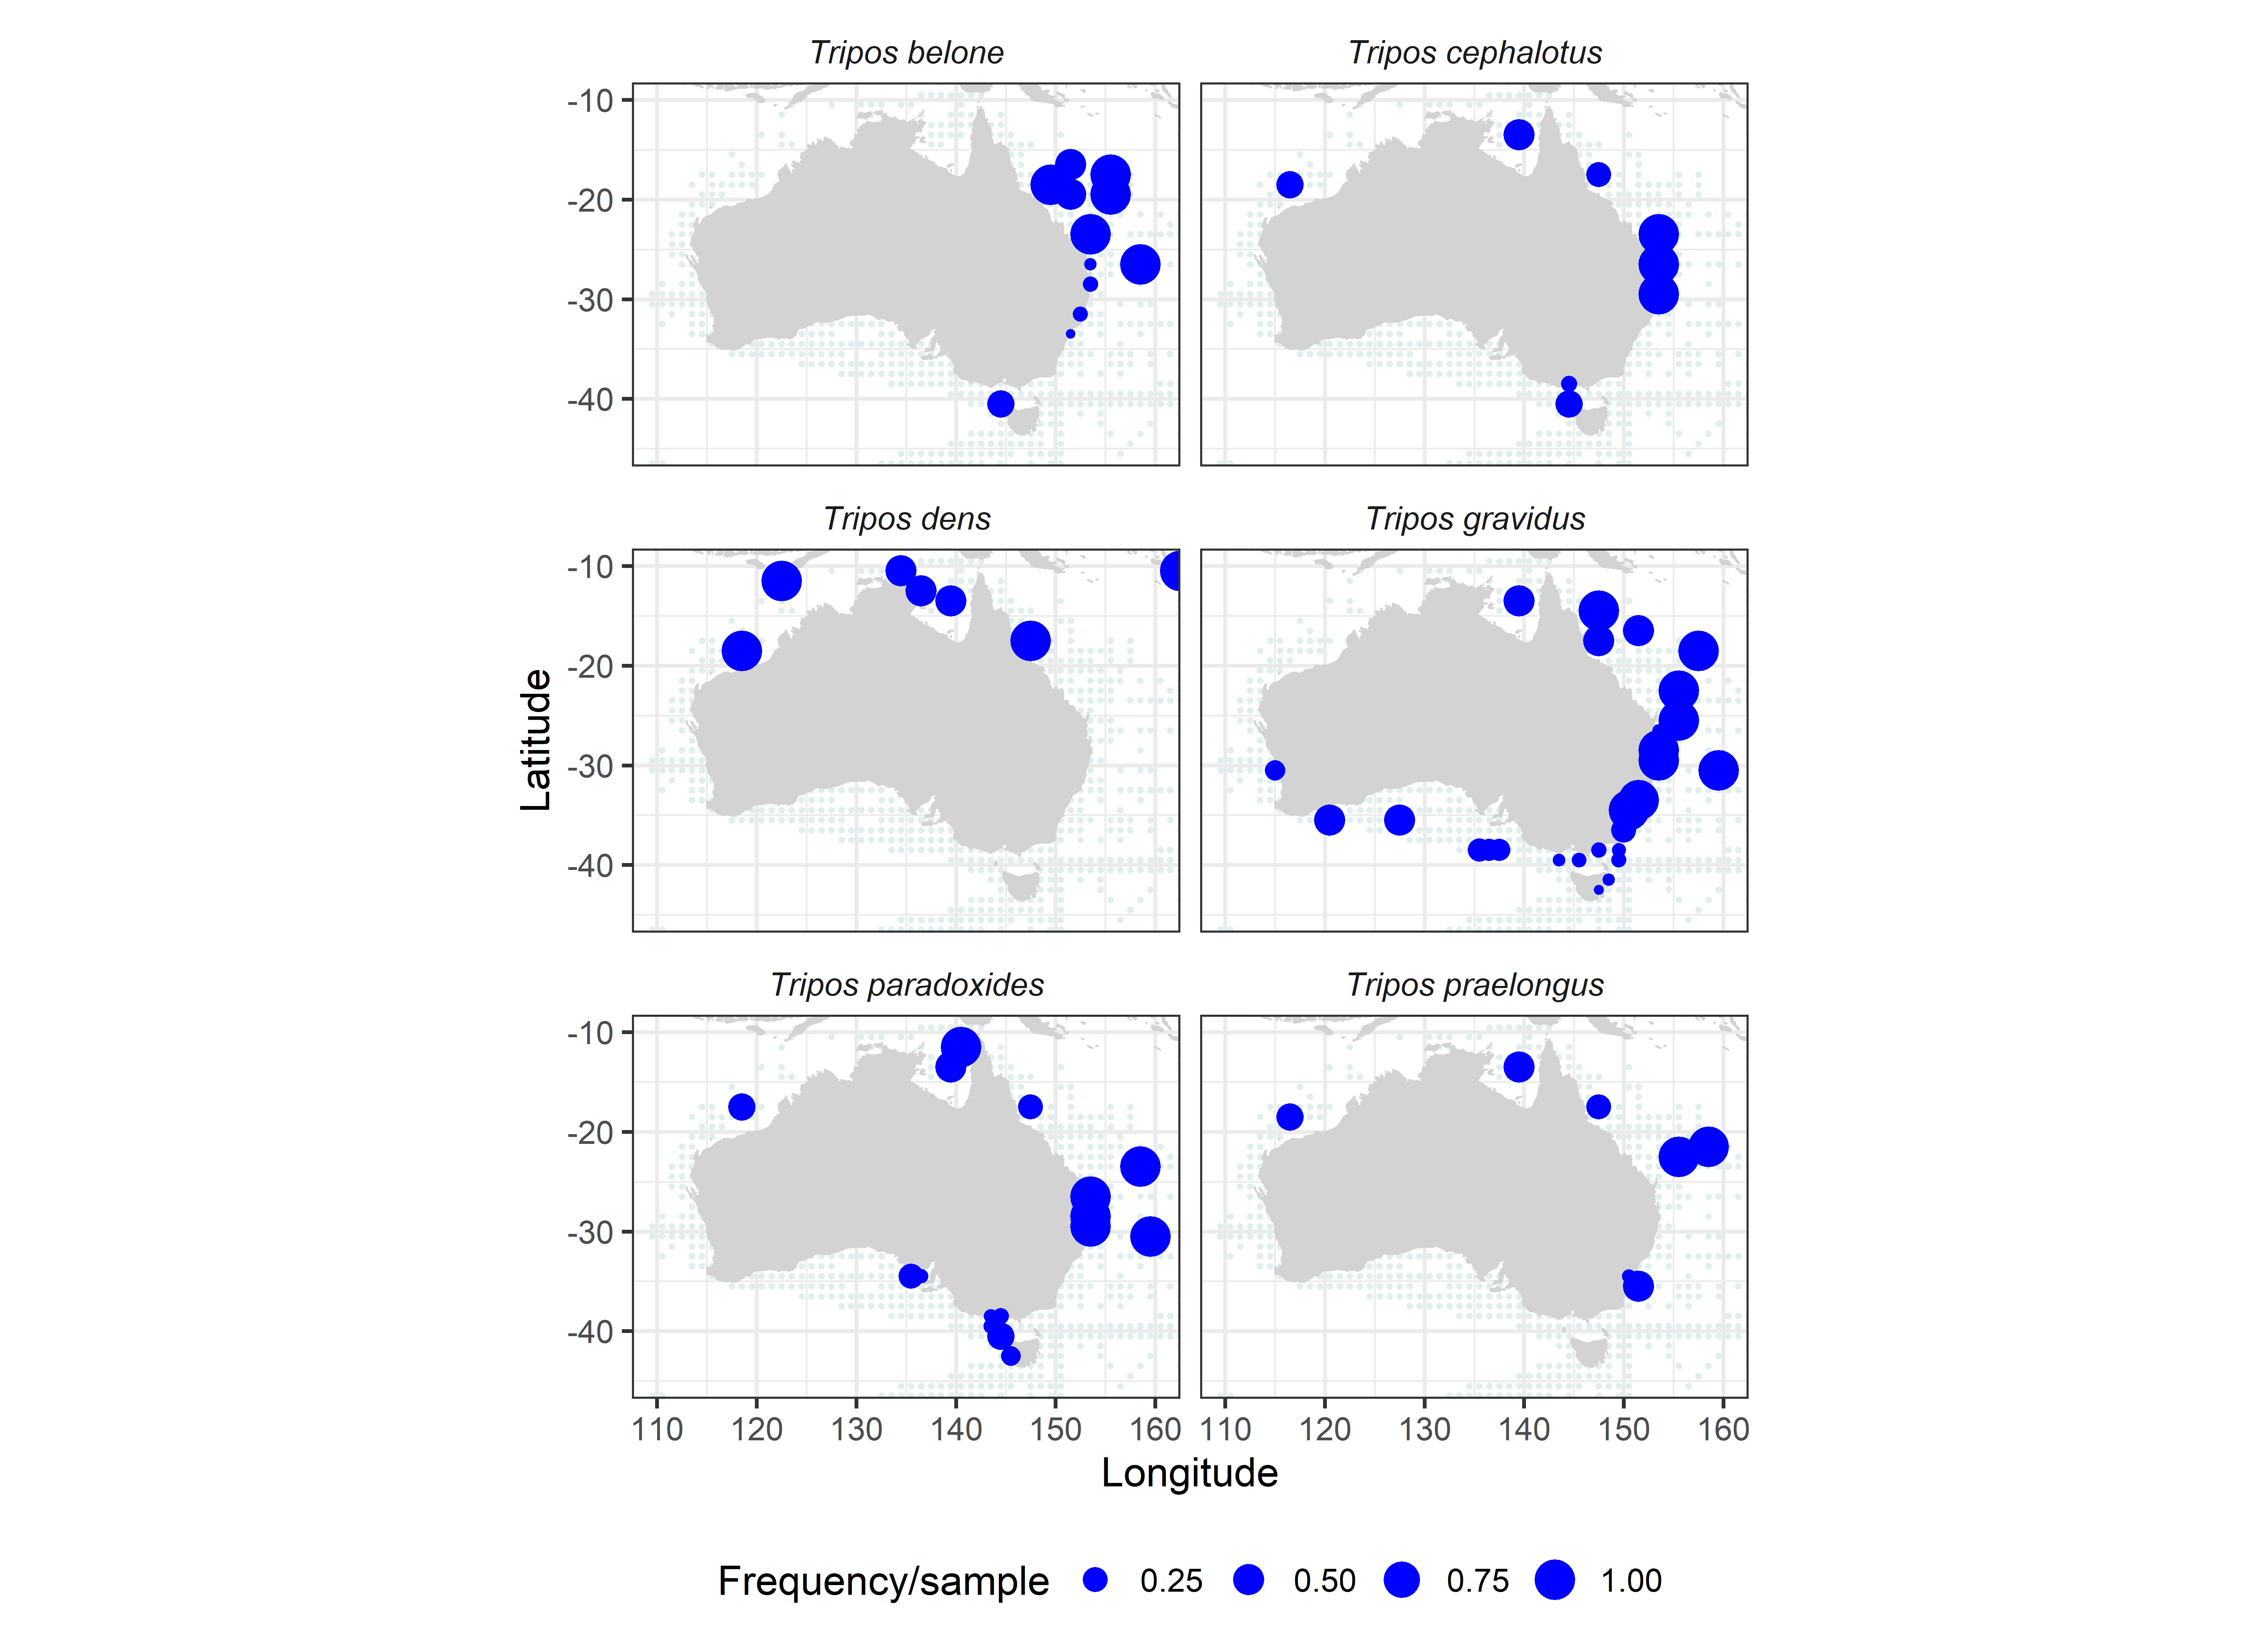
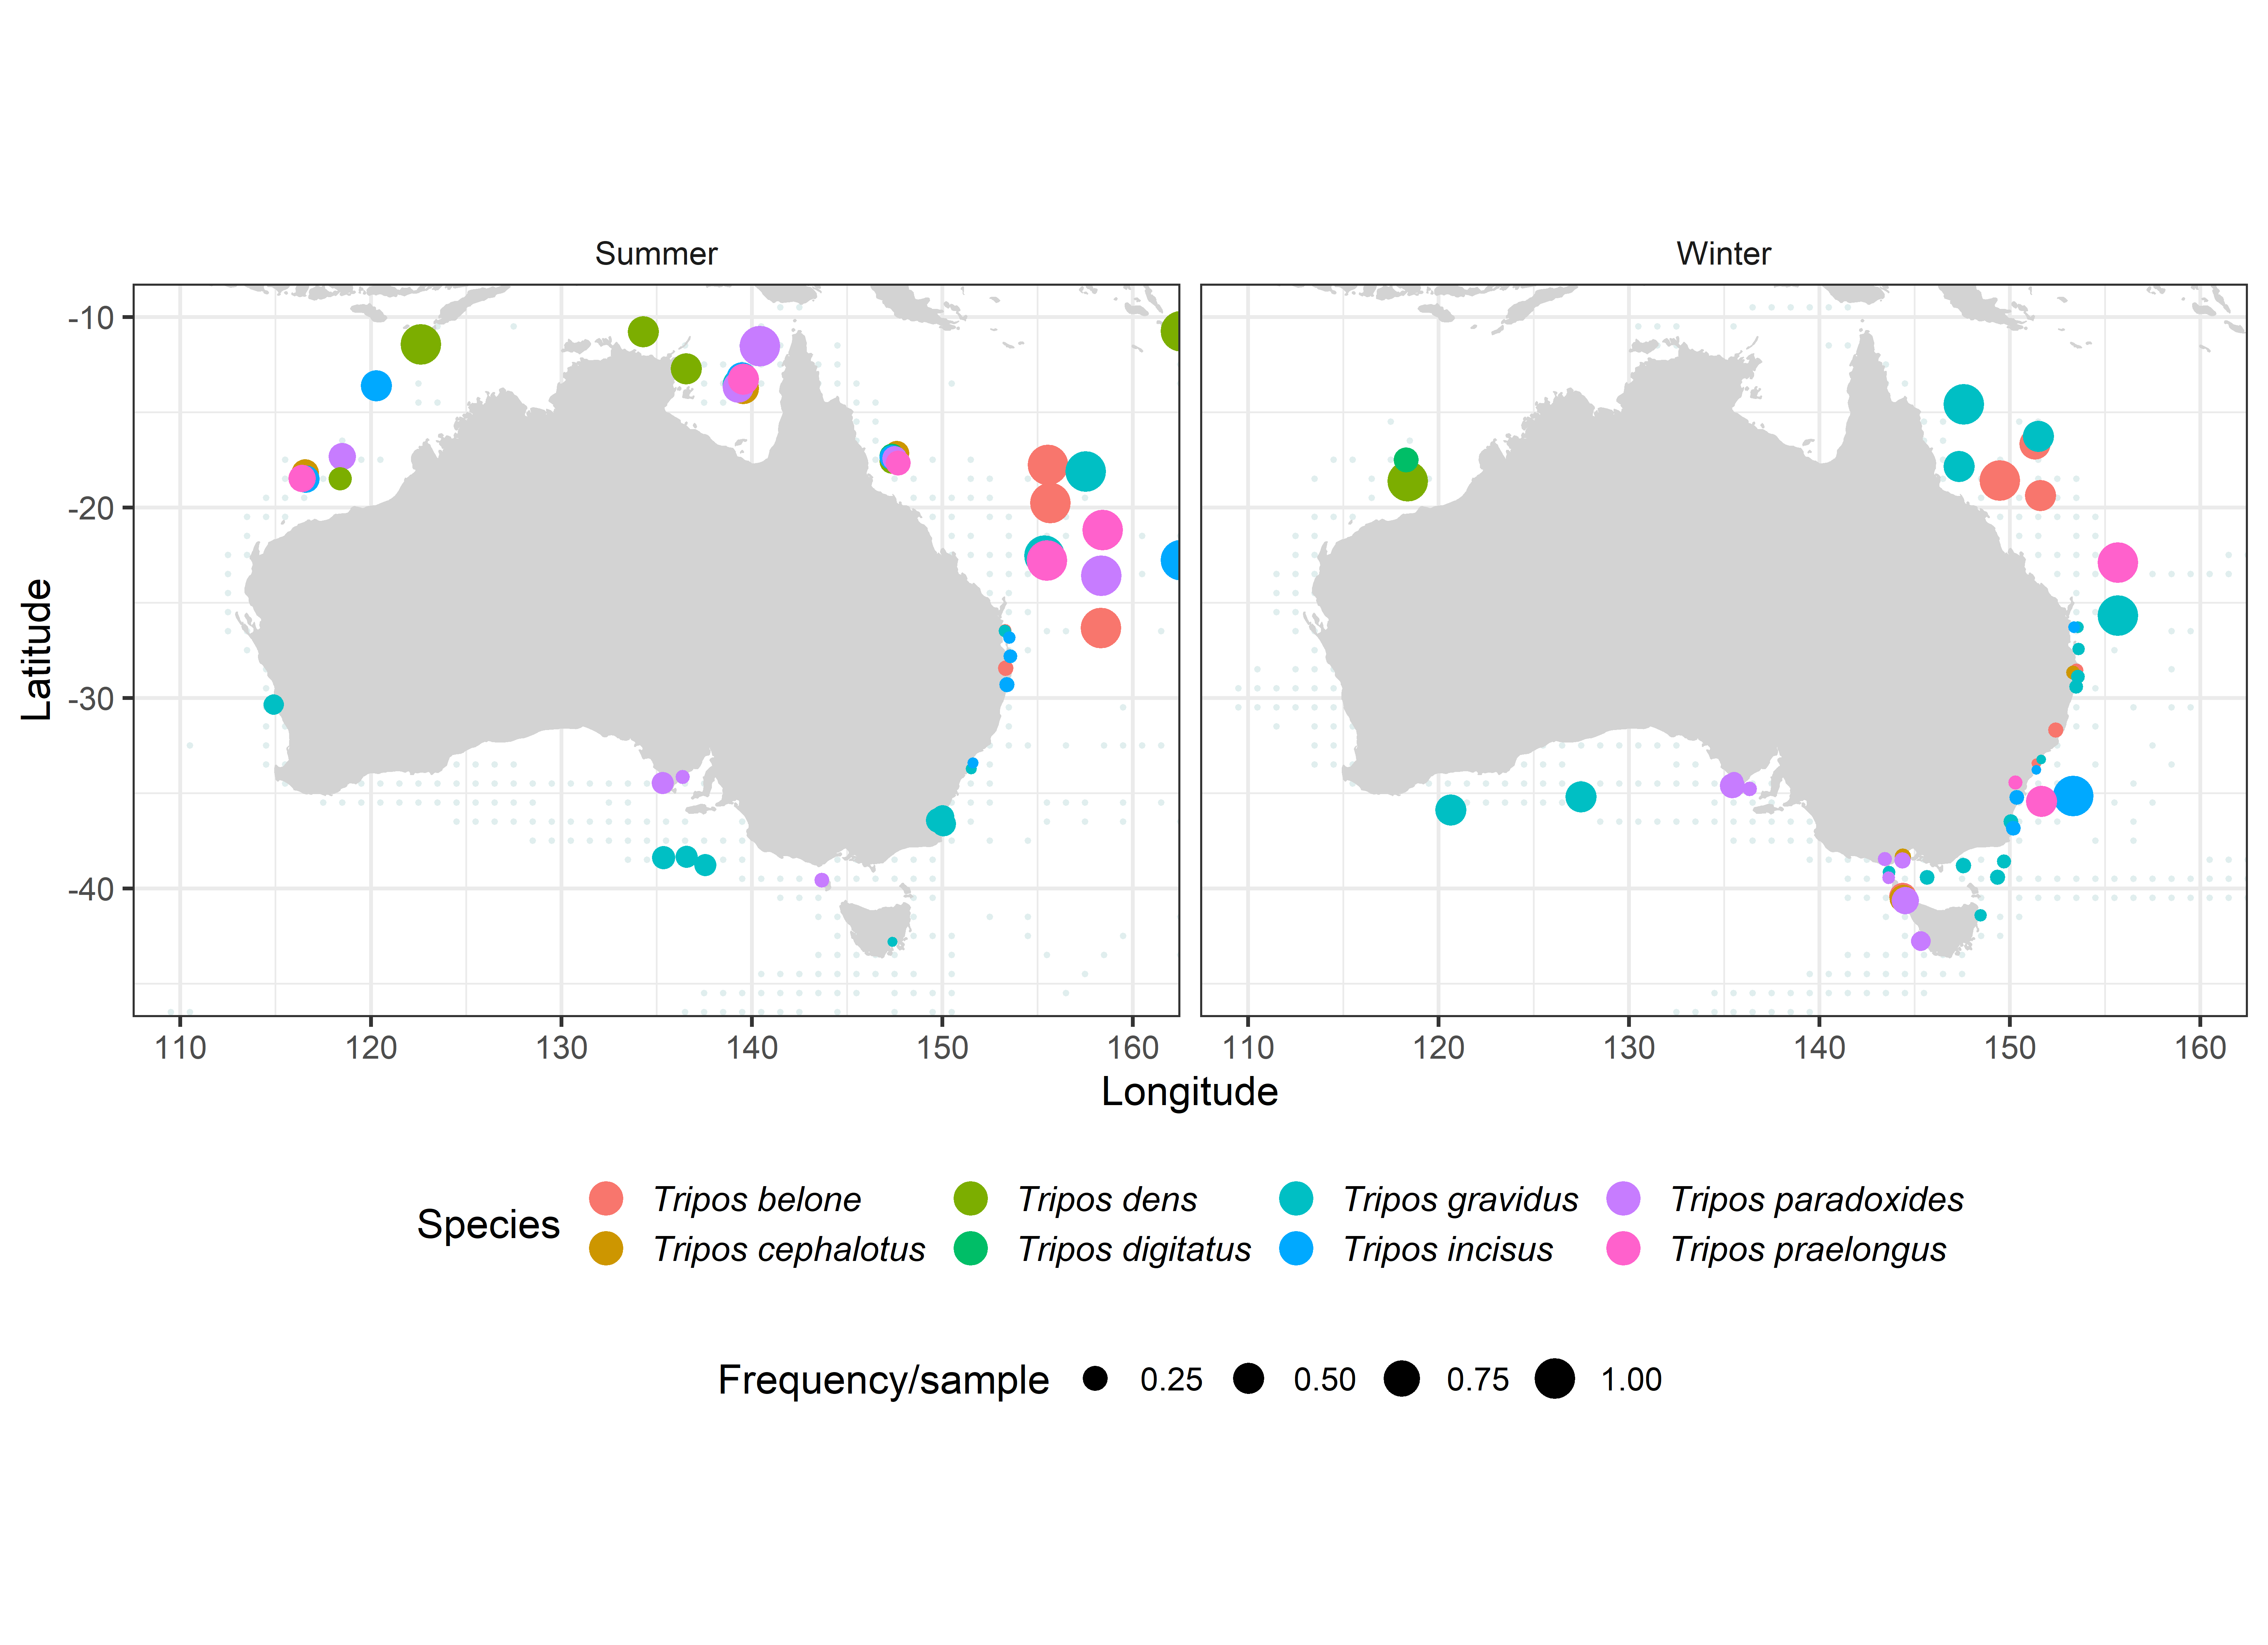
While the distributions of a large number of the total of 50+ Australian Tripos dinoflagellate species have remained remarkably stable over the past 60-80 years, we identified a group of  8 rare tropical species that deserve careful attention in monitoring for range expansions, changes in seasonality or incursion of deep tropical waters.


Keywords

Continuous Plankton Recorder, indicator species, East Australian Current, range extension

Tripos dinoflagellates as indicators of Australian marine bioregions

Dinoflagellates belonging to what used to be referred to as the genus Ceratium, now redesignated Tripos, are widespread in marine waters, particularly outside the polar waters. The genus exhibits an amazing morphological diversity, with >77 species and numerous varieties and forms documented globally, and with numerous regional taxonomic monographs (Figure 1). Many studies hint at the potential of using Tripos species as water mass indicators to detect environmental change, which has been quantitatively explored for the North Atlantic (Dodge & Marshall, 1994) and the Mediterranean Sea (Tunin-Ley, Ibanez, Labat, Zingone, & Lemée, 2009). Previous comprehensive Tripos surveys of Australian species include Wood’s (1954) dinoflagellate monograph of 71 taxa. These early studies produced the first conclusive biological evidence for what is now called the Leeuwin Current, which occasionally transports dinoflagellates from the Indian Ocean all the way to the west coast of Tasmania. Huisman (1989) focused on Tripos in 7 years (1979-1985) of net samples from Bass Strait (32 taxa). In adjoining Indian Ocean waters, Taylor (1976) characterized 56 Tripos taxa. In the period 1978-1984, as part of a series of CSIRO Division of Fisheries & Oceanography cruises, Hallegraeff and co-workers (1984) reported Tripos species from New South Wales coastal waters, East Australian Current eddies, the Coral Sea, North West Shelf and Gulf of Carpentaria. Here we summarise Tripos species in Australian tropical, subtropical, temperate and Southern Ocean environments.

Observations since 2007 were based on 614 Integrated Marine Observing System (IMOS) National Reference Station and 4263 Continuous Plankton Recorder samples from the Australian and Southern Ocean Continuous Plankton Recorder Surveys, and the phytoplankton and zooplankton samples from the IMOS National Reference Stations (Eriksen et al., 2019). Historical records of Tripos were obtained from the Australian Phytoplankton Database (8818 records) (Davies et al., 2016). All data were sourced from the AODN (https://portal.aodn.org.au/; see the datasets IMOS National Reference Station (NRS) - Phytoplankton Abundance and Biovolume”, “IMOS - AusCPR: Phytoplankton Abundance”, and “The Australian Phytoplankton Database (1844 - ongoing) - abundance and biovolume”).

We performed three separate analyses – one for Maria Island, one for Port Hacking, and one for Yongala. All analyses compare current IMOS data with historical data from the Australian Zooplankton Database (Davies et al., 2014). For Port Hacking, IMOS samples from 2009-2018 were compared with two historical datasets. The first was 29 samples collected monthly from January 1931 to March 1932 by Dakin & Colefax (1940). The second was more recent; 71 samples were collected monthly from 2001-2008 (by the NSW Environment Agency). The 2001-2008 data were counted in the same way and by the same people as the 2009-2018 IMOS (104 samples). Only the most abundant 15 species were reported historically from 1931-1932, so these same species were extracted from the more recent data for comparison using the CTI.

For Maria Island, the historical dataset was collected monthly from August 1971 to May 1973 over a grid off the east coast of Tasmania by Nyan Taw (1975). We retained samples in our analysis that were within 150 km of Maria Island and <200 m depth to ensure similar conditions to the current IMOS National Reference Station. We then compared these data with IMOS data collected from January 2009 to the present. As the 1971-1973 data included only 25 copepod species, we selected the same species from the 2009-2018 period.

For Yongala, we use copepod data the 1928-1929 GBR expedition (Farran, 1949), Peter Liston’s PhD thesis (Liston, 1990), sampling in the early 2000s (Mckinnon, Duggan, & De'ath, 2005), and IMOS data since 2009.

To estimate the preferred temperature for each of the copepod species in both analyses, we used data on the abundance of copepods from 20,000 samples collected as part of the IMOS National Reference Stations, the Australian Continuous Plankton Recorder survey, and the Southern Ocean Continuous Plankton Recorder survey (Eriksen et al., 2019; Hosie, Fukuchi, & Kawaguchi, 2003). We assigned each sample a temperature based on a weekly composite from remote sensing data, and plotted the abundance of each species vs temperature in 0.5°C temperature bands and fitted kernel density models (Figure 2). The preferred temperature for each species is called the species temperature index and is defined as the temperature of maximum abundance (Stuart-Smith et al. 2015).

To calculate the CTI for each sample (i.e., the overall temperature preference of the copepods in a sample), we multiplied the abundance of each species by its thermal preference (i.e., species temperature index), and divided by the total abundance of these species in the sample (Stuart-Smith et al. 2015). As the same species are used to compare with historical and current data, any changes in the CTI are due to the relative changes in abundance of cold and warm-water species, and not to the influx of new warm-water species. This is a cautious approach, as it is less biased by differences in the ability to sample and identify rare species.

The last part of the analysis was to use a linear model to test whether there had been an increase in the CTI from the historical period (1931-1932 at Port Hacking; 1971-1973 at Maria Island) to the more recent period (2001-2008 and 2009-2018 at Port Hacking; 2009-2018 at Maria Island). Historical data were sourced from the “The Australian Zooplankton Database” (Davies et al. 2014; data available at  https://figshare.com/articles/Data_Paper_Data_Paper/3560811). Recent data (from IMOS) were sourced from the AODN (dataset “IMOS National Reference Station (NRS) - Zooplankton Abundance”). We adjusted for the seasonal cycle in the analysis by including Month in the linear model.

Tripos in Australian waters exhibit a striking species richness, with most offshore sample locations containing 5-10 species. Tripos is best collected by phytoplankton or zooplankton nets, such as the surface to 100 µm drop nets in the Coral Sea, which also catch deep “shade” species (Sournia (1982). Tunin-Ley et al. (2009) in the Mediterranean Sea determined that a minimum sample volume of 70 L was needed for a sound estimate of Tripos species richness. The traditional bottle sampling of phytoplankton is insufficient.

Some apparent decadal shifts in Australian distribution patterns (Figure 2) simply reflect the fact that Wood’s sampling focus was on the East Coast of Australia, while IMOS sampling covered the entire region.

The majority of Tripos species exhibit broad temperate to subtropical to tropical temperature preference (10-25°C), which essentially covers all Australian waters. This limits the use of Tripos indicator species in the Australian region. This is well demonstrated by the distributions of Tripos carriense, T. falcatus, T. furca, T. fusus, T. gibberus, T. hexacanthus, T. limulus, T. massiliense, T. muelleri, T. platycornis, and T. ranipes, which have remained remarkably stable in Australian waters over the past 60-80 years (Figure 3, Figure 4). It is noted that some species which are used as warm-water indicators in the North Atlantic (e.g. T. hexacanthus, 7-30°C, but “prefers higher temperature”) are not necessarily diagnostic for warm waters of the Australian region (Figure 4). Similarly, Tunin-Ley et al. (2009) observed some strictly warm-water species such as T. digitatus in winter in the Mediterranean Sea.

Using the strict definition of stenothermal tropical species, agreed to by both Dodge & Marshall (1994) and Taylor (1976), we identified a restricted group of warm-water species including T. belone, T. cephalotus, T. dens, T. digitatus, T. gravidus, T. incisus, T. paradoxides, and T. praelongus (Figure 5). These tropical species are commonly encountered off Sydney (T. digitatus, T. gravidus), and more rarely down to Eden and Batemans Bay (T. praelongus, Sept 84) or Bass Strait (Huisman 1989: T. gravidus, T. paradoxides), but have occasionally been observed as far south as King Island (T. cephalotus, August 84) and even Tasmania off Maria Island (T. gravidus Sept 84) and the Huon River (T. gravidus Dec 2013, Nov 2018). These comparatively rare tropical Australian Tripos species are probably carried south on the East Australian Current and deserve careful attention in monitoring for future range expansions, changes in seasonality (Figure 6), or signs of upwelling/incursion of deep tropical waters (Sournia, 1982).

Phytoplankton have been used successfully to increase our knowledge of the extent of water mass circulation by acting as indicator species. The ability to monitor changes in the extent and persistence of changes in water mass circulation relies heavily on long-term biological time-series, with sufficient taxonomic resolution to provide quantitative evidence of species range shifts or thermal niches (Buchanan, Swadling, Eriksen, & Wild-Allen, 2013; Eriksen et al., 2019). Tripos is a valuable indicator in this regard, but it is only through the careful curation of historical datasets, and species level data that these lines of evidence can be utilised. Shifts in species ranges due to changes in environmental conditions in the pelagic environment can have impacts on the food availability for higher trophic levels, potentially affecting the commercial and recreational fisheries that depend upon these food resources. Now that we have a validated dataset on Tripos from the 1940s to the present, the next step will be to derive indicators of change that are robust to the different sampling methods and focal regions.

Beaugrand, G., Reid, P. C., Ibanez, F., Lindley, J. A., & Edwards, M. (2002). Reorganization of North Atlantic marine copepod biodiversity and climate. Science, 296(5573), 1692-1694. Retrieved from <Go to ISI>://000175976200060

Beaugrand, G., Souissi, S., Reid, P. C., Brander, K. M., & Alistair Lindley, J. (2003). Plankton effect on cod recruitment in the North Sea. Nature, 426(6967), 661-664.

Bonnet, D., Richardson, A., Harris, R., Hirst, A., Beaugrand, G., Edwards, M., . . . Fernandez de Puelles, M. L. (2005). An overview of Calanus helgolandicus ecology in European waters. Progress in Oceanography, 65(1), 1-53. doi:https://doi.org/10.1016/j.pocean.2005.02.002

Cai, W., Shi, G., Cowan, T., Bi, D., & Ribbe, J. (2005). The response of the Southern Annular Mode, the East Australian Current, and the southern mid-latitude ocean circulation to global warming. Geophysical Research Letters, 32(23). doi:L23706

10.1029/2005gl024701

Campbell, M. (2018). Testing macroecological patterns that drive community structure using zooplankton in the global ocean. (Honours thesis). University of Queensland,

Dakin, W. J., & Colefax, A. (1940). The plankton of the Australian coastal waters off New South Wales Part I. Publications of the University of Sydney, 210.

Davies, C. H., Armstrong, A. J., Baird, M., Coman, F., Edgar, S., Gaughan, D., . . . Richardson, A. J. (2014). Over 75 years of zooplankton data from Australia. Ecology, 95(11), 3229-3229. doi:10.1890/14-0697.1

Edwards, M., & Richardson, A. J. (2004). Impact of climate change on marine pelagic phenology and trophic mismatch. Nature, 430(7002), 881-884. Retrieved from 10.1038/nature02808

http://search.ebscohost.com/login.aspx?direct=true&db=anh&AN=14162038&site=ehost-live

Eriksen, R. S., Davies, C. H., Bonham, P., Coman, F. E., Edgar, S., McEnnulty, F., . . . Richardson, A. J. (2019). Australia’s long-term plankton observations: the Integrated Marine Observing System National Reference Station network. Frontiers in Marine Science, 6(Article 161), 17.

Farran, G. P. (1949). The seasonal and vertical distribution of the copepoda. In Scientific Reports (Vol. Great Barrier Reef Expedition 1928 - 1929 Volume 2).

Hosie, G. W., Fukuchi, M., & Kawaguchi, S. (2003). Development of the Southern Ocean Continuous Plankton Recorder survey. Progress in Oceanography, 58(2-4), 263-283. doi:10.1016/j.pocean.2003.08.007

Lindley, J. A., & Daykin, S. (2005). Variations in the distributions of Centropages chierchiae and Temora stylifera (Copepoda: Calanoida) in the north-eastern Atlantic Ocean and western European shelf waters. ICES Journal of Marine Science, 62(5), 869-877. doi:10.1016/j.icesjms.2005.02.009

Liston, P. W. (1990). Spatial variability and covariability of chlorophyll and zooplanktn on the Great Barrier Reef. (PhD). James ook University,

Mckinnon, A. D., Duggan, S., & De'ath, G. (2005). Mesozooplankton dynamics in nearshore waters of the Great Barrier Reef. Estuarine, Coastal and Shelf Science, 63(4), 497-511. doi:10.1016/j.ecss.2004.12.011

Poloczanska, E. S., Brown, C. J., Sydeman, W. J., Kiessling, W., Schoeman, D. S., Moore, P. J., . . . Richardson, A. J. (2013). Global imprint of climate change on marine life. Nature Climate Change, 3, 919. doi:10.1038/nclimate1958 https://www.nature.com/articles/nclimate1958#supplementary-information

Richardson, A. J. (2008). In hot water: zooplankton and climate change. ICES Journal of Marine Science, 65(3), 279-295. doi:10.1093/icesjms/fsn028

Richardson, A. J., & Schoeman, D. S. (2004). Climate impact on plankton ecosystems in the northeast Atlantic. Science, 305(5690), 1609-1612. doi:10.1126/science.1100958

Ridgway, K. R. (2007). Long-term trend and decadal variability of the southward penetration of the East Australian Current. Geophysical Research Letters, 34(13). doi:10.1029/2007gl030393

Stuart-Smith, R. D., Edgar, G. J., Barrett, N. S., Kininmonth, S. J., & Bates, A. E. (2015). Thermal biases and vulnerability to warming in the world’s marine fauna. Nature, 528, 88. doi:10.1038/nature16144 https://www.nature.com/articles/nature16144#supplementary-information

Taw, N. (1975). Studies on the zooplankton and hydrology of south-eastern coastal waters of Tasmania. University of Tasmania, Hobart.

Figure 1

A selection of Tripos dinoflagellate species from the Port Hacking station off Sydney, Australia, hand-picked, sorted and photographed on the same scale (1000 mm). a. Tripos fusus; b. T. falcatus; c. T. biceps; d. T. trichoceros; e. T. macroceros; f. T. carriensis; g. T. massiliensis; h. T. lunula; i. T. symmetricus; j. T. claviger; k. T. patentissimus; l. T. muelleri; m. T. candelabrus; n. T. ranipes; o. T. muelleri var. atlanticus; p. T. vultur. Micrograph J. Uribe-Palomino.

Figure 2

Collation over the period 1940-2019 of Australia-wide distribution records of 20 Tripos species.

Figure 3

Sixty+ years of Australian distribution records of the widespread Tripos furca  reflect temporal shifts in sampling efforts.

Figure 4

Thermal preferences of Tripos species estimated from IMOS data using kernel density. The temperature which gives the highest kernel density value is the Species Temperature Index (STI) and is a measure of whether a species prefers warm or cold water.

Figure 5

Australian distribution records of 6 stenothermal warm-water Tripos species.

Figure 6

Seasonality of stenothermal warm-water Tripos species reflects upwelling in the Coral Sea, East Australian Current activity in summer, and Leeuwin Current activity in winter, as first postulated by Wood 1954.

Download this Time Series Report

Citing this report: 

Hallegraeff G, Davies C, Eriksen R. Tripos dinoflagellates as indicators of Australian marine bioregions.In Richardson A.J, Eriksen R, Moltmann T, Hodgson-Johnston I, Wallis J.R. (Eds). State and Trends of Australia’s Ocean Report. doi: 10.26198/5e16ac0f49e82

doi: 10.26198/5e16ac0f49e82

Access the Data

Access the data that contributes to this time-series by clicking the icons below

02. SOOP-02

Ships of Opportunity

06f. National Reference stations-02

National Reference Stations

10. AODN-02

Australian Ocean Data Network (AODN)

Citing the Report

Richardson A.J, Eriksen R, Moltmann T, Hodgson-Johnston I, Wallis J.R. (2020). State and Trends of Australia’s Ocean Report, Integrated Marine Observing System (IMOS).

IMOS_logo-stacked-reversed-01

The State and Trends of Australia's Ocean Report was supported by IMOS. IMOS gratefully acknowledges the additional support provided by the Commonwealth Scientific and Industrial Research Organisation (CSIRO).

The State and Trends of Australia's Ocean website is maintained by IMOS.


NCRIS-PROVIDER-REV

Australia’s Integrated Marine Observing System (IMOS) is enabled by the National Collaborative Research Infrastructure Strategy (NCRIS). It is operated by a consortium of institutions as an unincorporated joint venture, with the University of Tasmania as Lead Agent.

Disclaimer:

You accept all risks and responsibility for losses, damages, costs and other consequences resulting directly or indirectly from using this site and any information or material available from it. While the Integrated Marine Observing System (IMOS) has taken reasonable steps to ensure that the information on this website and related publication is correct, it provides no warranty or guarantee that information provided by the authors is accurate, complete or up-to-date. IMOS does not accept any responsibility or liability for any actions taken as a result of, or in reliance on, information on its website or publication. Users should check with the originating authors to confirm the accuracy of the information before taking any action in reliance on that information.

If you believe any information on this website or in the related publication is inaccurate, out of date or misleading, please bring it to our attention by contacting the authors directly or emailing us at IMOS@imos.org.au


Images and Information:

All information on this website remains the property of those who authored it. All images on this website are licensed through Adobe Stock, Shutterstock, or have permission from the original owner.