Biological Time Series - Productivity

2.6

Picophytoplankton: harbingers of change in our coastal oceans

Contributors

Paul G. Thomson1,2

Dion M.F. Frampton3

Lesley A. Clementson3

Chari B. Pattiaratchi1,2

1 Oceans Graduate School, The University of Western Australia, Crawley, WA, Australia
2 UWA Oceans Institute, The University of Western Australia, Crawley, WA, Australia
3 CSIRO, Oceans and Atmosphere, Hobart, Tasmania, 7000, Australia

Key Information

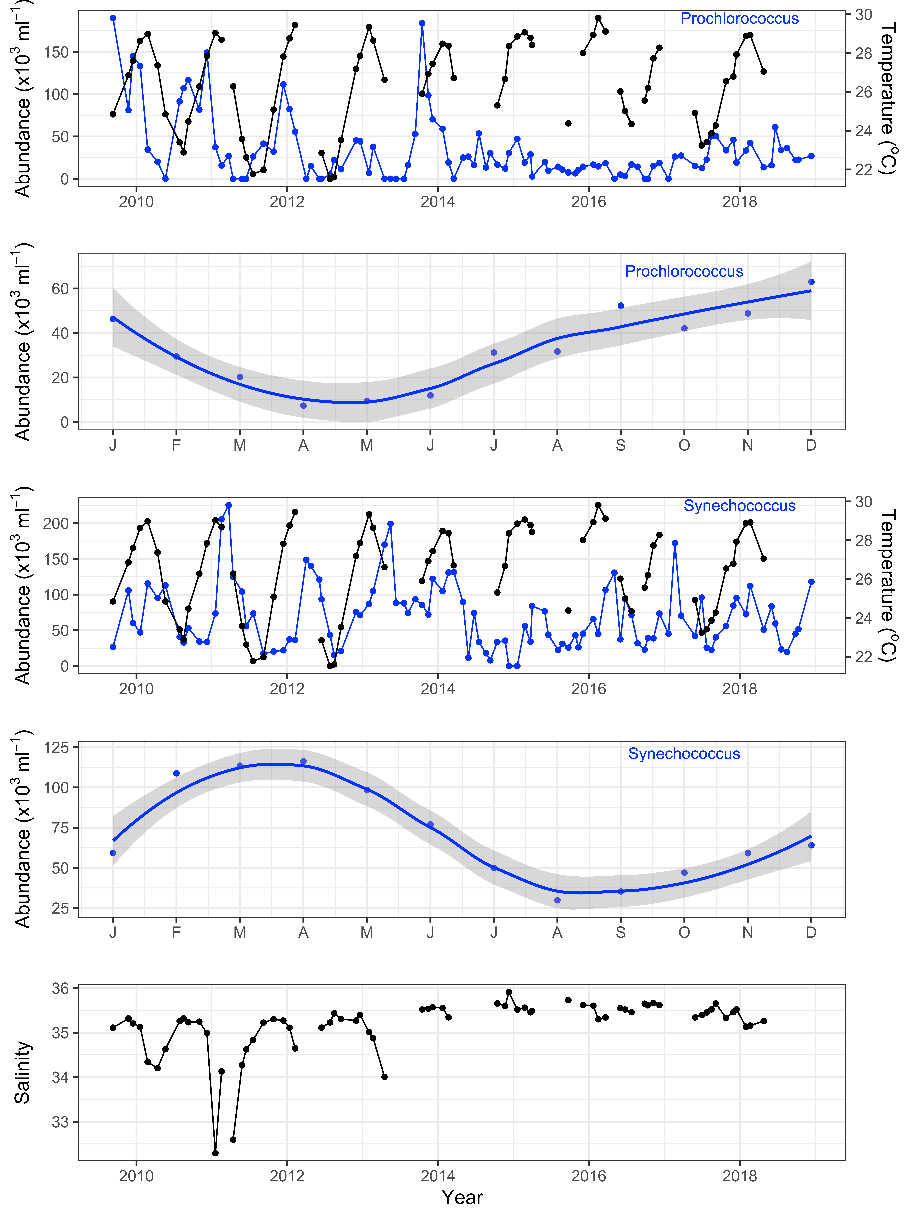
Strengthening boundary currents and episodic marine heatwaves are carrying tropical and subtropical picophytoplankton species such as Prochlorococcus and Synechococcus far into temperate southern waters around Tasmania and South West Australia, with implications for both people and ecosystems. As biomarkers for warmer currents, the picophytoplankton are sensitive indicators of tropical/subtropical microbial communities and thus may 1) afford us a glimpse of future microbial communities in our warming southern oceans and 2), help us model the spread of viral diseases, pathogens and other microbes along our coastlines. Using sensitive biomarkers such as the picophytoplankton will help us understand changes in marine microbial communities at the base of the marine food chain and subsequent impacts on the environment and marine industry such as aquaculture.

Keywords

microbial communities, biomarkers, aquaculture, El Niño–Southern
Oscillation (ENSO)

Picophytoplankton: harbingers of change in our coastal oceans

Australia’s’ coastal oceans are changing. Our major boundary currents, the southward-flowing East Australian Current off the east coast and the Leeuwin Current off the west coast are changing and are penetrating warm tropical water further south, sometimes resulting in devastating marine heatwaves (Oliver et al., 2017). These changes have led to the ‘tropicalisation’ of Australia’s southern coastlines and are responsible for the loss of seagrass meadows, kelp forests, species translocations, and impacts on fisheries and aquaculture (Babcock et al., 2019; Oliver et al., 2018; Wernberg et al., 2016). However, little is known of the changes within the less visible, marine microbial communities that form the base of the marine food web. Here we show that the smallest size class of the phytoplankton, the picophytoplankton, are being carried southwards. As sensitive biomarkers of change, their appearance in southern waters may be indicative of future marine microbial communities, with implications for our blue economy.

The picophytoplankton, Prochlorococcus and Synechococcus, are small (< 2µm diameter) photosynthetic, cyanobacterial cells that contribute most of the primary productivity to the world’s open oceans (Worden, Nolan, & Palenik, 2004). Both genera inhabit specific niches. Prochlorococcus flourishes in warm, tropical waters with few nutrients and abundant light, and tends to be intolerant of coastal waters. By contrast, Synechococcus is distributed further into subtropical zones and is most abundant in upwelling areas or coastal regions where waters are nutrient replete and more turbid. Being so small, picophytoplankton have a large surface area to volume ratio, which places them in intimate contact with surrounding seawater. This results in the cells being able to rapidly access nutrients, allowing them to respond quickly to changing environmental conditions. Picophytoplankton are also light and buoyant, rendering them capable of being carried long distances by ocean currents. Picophytoplankton are thus sensitive indicators of change in our coastal oceans.

We used samples from the Integrated Marine Observing System (IMOS) National Reference Stations (NRS) at Yongala, Maria Island and Rottnest Island to analyse the abundance of picophytoplankton between 2009 and 2018. These sites were chosen as they represented regions that were strongly influenced by Australia’s boundary currents. Triplicate 1 ml seawater samples for the picophytoplankton were collected monthly from pooled water samples over several depths, fixed to a final concentration of 0.5% gluteraldehyde, and frozen in liquid nitrogen until analysis. Picophytoplankton abundance was analysed by standard flow cytometric methods where populations of Prochlorococcus and Synechococcus were discriminated based on their relative autofluorescence of chlorophyll-a (red) and phycoerythrin (orange) pigments (Marie, Simon, & Vaulot, 2005). A Beckton Dickinson FacsCanto flow cytometer analysed samples from 2009, but a CytoSense cytometer was used from September 2015. Counts between the two instruments were calibrated by determining the relationship between replicate samples taken over a four-year period from 2013 to 2017, and calculating a corresponding conversion factor (Frampton, Thompson, & Clementson, 2019). We used the accessory pigment divinyl chlorophyll-a (a marker for Prochlorococcus) from simultaneous water samples to help correct for false detections. Where divinyl chlorophyll-a was not detected, we removed counts resulting from particle and electronic noise. We matched picophytoplankton abundances to seawater temperature and salinity time series from the IMOS NRS stations and known events impacting the station such as cyclones, monsoonal rainfall and marine heatwaves.

Yongala, North Queensland

At the Yongala NRS, seasonal patterns of seawater temperature, salinity and picophytoplankton abundance illustrate the preferential niche of the picophytoplankton (Figure 1). Prochlorococcus is generally most abundant during spring and summer, when seawater temperatures are rising under the influence of the warm, clear Pacific waters feeding the source of the EAC. Prochlorococcus abundance, however, declines abruptly early in the year, with relatively large decreases in seawater salinity caused by either rainfall from cyclones (e.g., Tropical Cyclone Yasi in 2011) or the monsoon season between December to March. Cyclones and high rainfall also result in mixing and sediment runoff, which increase both nutrient concentrations and turbidity (data not shown), conditions not favourable for Prochlorococcus. Conversely, Synechococcus abundances increase from late summer through to autumn, before declining with cooler temperatures into winter, confirming their preference for warm, turbid and nutrient-rich seawater. Over the longer term, patterns of picophytoplankton abundance appear to be influenced by the El Niño–Southern Oscillation (ENSO), where abundances can be higher during La Niña or neutral years (2009 – 2014) than in El Niño years (2015 onwards).

Rottnest Island, Western Australia

At the Rottnest Island NRS, seawater temperatures ranged between 18oC to 23oC between 2009 and 2018, with the exception of periods in 2011 and 2012 when temperatures reached 25oC (Figure 2). Elevated temperatures beginning in February 2011 were a result of a record strength Leeuwin Current and a severe marine heatwave, which persisted into 2012 (Feng, McPhaden, Xie, & Hafner, 2013). This is confirmed by the lower salinity seawater (a marker of the Leeuwin Current water) evident into 2012. An immediate effect of the heatwave was the unseasonal appearance of the tropical Prochlorococcus at the Rottnest Island NRS, at abundances at least twice the values observed outside the heatwave conditions. Further, Prochlorococcus abundance remained elevated throughout 2011 and into 2012, carried by the persistent Leeuwin Current. At this site, Synechococcus abundances correlated poorly with the marine heatwave conditions and appeared influenced more by coastal upwelling water of the inshore northward flowing Capes Current.

Maria Island, Tasmania

At the Maria Island NRS, seawater temperature has distinct seasonal cycles and peaks in late summer each year (Figure 3). Since 2009 at this temperate site, there have been small peaks in abundance of the tropical Prochlorococcus of up to 40 000 cells ml-1 most summers. The subtropical Synechococcus was also recorded most summers and appears to increase in abundance to 2014, before remaining at stable but elevated concentrations through to the most recent observations. Further, peaks in Synechococcus abundance were only found in a single month prior to 2014, but were found over at least two successive months from 2014, indicating prolonged exposure to tropical waters. A warming trend has been recorded at the Maria Island NRS over the past 50 years (Kelly, Clementson, Davies, Corney, & Swadling, 2016; Kelly, Clementson, & Lyne, 2015; Ridgway, 2007), and the east coast of Tasmania has experienced marine heatwaves since 2015 until present day (Oliver et al., 2018). Both the gradual warming and the marine heatwaves have been attributed to the increasing strength of the EAC extension to 2014 and the impact of its’ eddies that have intensified from 2015. Thus, the appearance of the tropical and subtropical picophytoplankton appear to be a direct result of transport by the EAC southwards along the Tasmanian coast.

Data from the IMOS NRS show that picophytoplankton are sensitive biomarkers of environmental conditions. Picophytoplankton have specific environmental niches and respond quickly to changing conditions, such as decreasing salinity resulting from rainfall and the passage of cyclones. We have provided evidence that tropical and subtropical picophytoplankton are increasing in abundance in southern Australian waters, either as a result of episodic marine heatwaves and/or through strengthening boundary currents. These increases in abundance represent an immediate ecological impact and are consistent with other impacts of warming along our southern coastlines, such as abalone mortality, fish kills, species translocations and the loss of kelp forests (Oliver et al., 2017; Pearce & Feng, 2013; Wernberg et al., 2016).

What is the significance of the picophytoplankton? As biomarkers for warmer currents, these light and buoyant cells can be used as proxies for understanding the spread of viral diseases, pathogens and other microbes along our coastlines, as well as impacts of marine heatwaves. For example, oyster aquaculture in Tasmania was severely impacted for the first time by the Pacific Oyster Mortality Syndrome (POMS) in 2015. Previously POMS was only known in NSW (Green, Montagnani, Benkendorff, Robinson, & Speck, 2014). Was this virus spread to Tasmanian waters by the EAC? The transport of the picophytoplankton southwards makes this and the translocation of other pathogens a possibility. Further, as picophytoplankton are biomarkers for tropical seawater, it is likely they are markers for tropical microbial communities, possibly of a different size class, species composition and nutritional quality than found locally. While the stress of hotter temperatures during marine heatwaves can impact wild shellfish (including fished species) and aquaculture shellfish such as farmed oysters, it is likely that a change in the underlying microbial community is responsible for additional, chronic stress to higher trophic levels. Finally, like our southern coastlines undergoing tropicalisation, the picophytoplankton biomarkers may also be giving us a glimpse of future microbial communities in our warming southern oceans.

Babcock, R. C., Bustamante, R. H., Fulton, E. A., Fulton, D. J., Haywood, M. D. E., Hobday, A. J., . . . Vanderklift, M. A. (2019). Severe continental-scale impacts of climate change are happening now: extreme climate events impact marine habitat forming communities along 45% of Australia’s coast. Frontiers in Marine Science, 6(411). doi:10.3389/fmars.2019.00411

Feng, M., McPhaden, M. J., Xie, S.-P., & Hafner, J. (2013). La Niña forces unprecedented Leeuwin Current warming in 2011. Scientific Reports, 3, 1277. doi:10.1038/srep01277. https://www.nature.com/articles/srep01277#supplementary-information

Frampton, D., Thomson, P. G., & Clementson, L. (2019). IMOS flow cytometry instrument comparison.

Green, T. J., Montagnani, C., Benkendorff, K., Robinson, N., & Speck, P. (2014). Ontogeny and water temperature influences the antiviral response of the Pacific oyster, Crassostrea gigas. Fish & Shellfish Immunology, 36(1), 151-157. doi:https://doi.org/10.1016/j.fsi.2013.10.026

Kelly, P., Clementson, L., Davies, C., Corney, S., & Swadling, K. (2016). Zooplankton responses to increasing sea surface temperatures in the southeastern Australia global marine hotspot. Estuarine Coastal and Shelf Science, 180, 242-257. doi:10.1016/j.ecss.2016.07.019

Kelly, P., Clementson, L., & Lyne, V. (2015). Decadal and seasonal changes in temperature, salinity, nitrate, and chlorophyll in inshore and offshore waters along southeast Australia. Journal of Geophysical Research-Oceans, 120(6), 4226-4244. doi:10.1002/2014jc010646

Oliver, E. C. J., Benthuysen, J. A., Bindoff, N. L., Hobday, A. J., Holbrook, N. J., Mundy, C. N., & Perkins-Kirkpatrick, S. E. (2017). The unprecedented 2015/16 Tasman Sea marine heatwave. Nature Communications, 8(1), 16101. doi:10.1038/ncomms16101

Oliver, E. C. J., Donat, M. G., Burrows, M. T., Moore, P. J., Smale, D. A., Alexander, L. V., . . . Wernberg, T. (2018). Longer and more frequent marine heatwaves over the past century. Nature Communications, 9(1), 1324. doi:10.1038/s41467-018-03732-9

Pearce, A. F., & Feng, M. (2013). The rise and fall of the "marine heat wave" off Western Australia during the summer of 2010/2011. Journal of Marine Systems, 111, 139-156. doi:10.1016/j.jmarsys.2012.10.009

Ridgway, K. R. (2007). Long-term trend and decadal variability of the southward penetration of the East Australian Current. Geophysical Research Letters, 34(13), 1-5. doi:L1361310.1029/2007gl030393

Wernberg, T., Bennett, S., Babcock, R. C., de Bettignies, T., Cure, K., Depczynski, M., . . . Wilson, S. (2016). Climate-driven regime shift of a temperate marine ecosystem. Science, 353(6295), 169. doi:10.1126/science.aad8745

Worden, A. Z., Nolan, J. K., & Palenik, B. (2004). Assessing the dynamics and ecology of marine picophytoplankton: The importance of the eukaryotic component. Limnology and Oceanography, 49(1), 168-179. doi:10.4319/lo.2004.49.1.0168

Figure 1

Picophytoplankton abundances and seasonal cycles at the IMOS Yongala National Reference Station. Also shown are temperature and salinity time series from the mooring. Note that there are missing data when the mooring has been damaged.

Figure 2

Picophytoplankton abundances and seasonal cycles at the IMOS Rottnest Island National Reference Station. Also shown are temperature and salinity time series from the mooring. Note that there are missing data when the mooring has been damaged.

Figure 3

Picophytoplankton abundances and seasonal cycles at the IMOS Maria Island National Reference Station. Also shown are temperature and salinity time series from the mooring. Note that there are missing data when the mooring has been damaged.


Download this Time Series Report

Citing this report: 

Thomson P.G, Frampton D.M.F, Clementson L.A, Pattiaratchi C.B. Picophytoplankton: harbingers of change in our costal oceans. In Richardson A.J, Eriksen R, Moltmann T, Hodgson-Johnston I, Wallis J.R. (Eds). State and Trends of Australia’s Ocean Report. doi: 10.26198/5e16a9dd49e7e

doi: 10.26198/5e16a9dd49e7e

Access the Data

Access the data that contributes to this time-series by clicking the icons below

06f. National Reference stations-02

National Reference Stations

Citing the Report

Richardson A.J, Eriksen R, Moltmann T, Hodgson-Johnston I, Wallis J.R. (2020). State and Trends of Australia’s Ocean Report, Integrated Marine Observing System (IMOS).

IMOS_logo-stacked-reversed-01

The State and Trends of Australia's Ocean Report was supported by IMOS. IMOS gratefully acknowledges the additional support provided by the Commonwealth Scientific and Industrial Research Organisation (CSIRO).

The State and Trends of Australia's Ocean website is maintained by IMOS.


NCRIS-PROVIDER-REV

Australia’s Integrated Marine Observing System (IMOS) is enabled by the National Collaborative Research Infrastructure Strategy (NCRIS). It is operated by a consortium of institutions as an unincorporated joint venture, with the University of Tasmania as Lead Agent.

Disclaimer:

You accept all risks and responsibility for losses, damages, costs and other consequences resulting directly or indirectly from using this site and any information or material available from it. While the Integrated Marine Observing System (IMOS) has taken reasonable steps to ensure that the information on this website and related publication is correct, it provides no warranty or guarantee that information provided by the authors is accurate, complete or up-to-date. IMOS does not accept any responsibility or liability for any actions taken as a result of, or in reliance on, information on its website or publication. Users should check with the originating authors to confirm the accuracy of the information before taking any action in reliance on that information.

If you believe any information on this website or in the related publication is inaccurate, out of date or misleading, please bring it to our attention by contacting the authors directly or emailing us at IMOS@imos.org.au


Images and Information:

All information on this website remains the property of those who authored it. All images on this website are licensed through Adobe Stock, Shutterstock, or have permission from the original owner.