Biological Time Series - Productivity

2.7

Status of Australian marine microbial assemblages

Contributors

Martin Ostrowski1

Justin Seymour1

Lauren Messer2

Deepa Varkey3

Kirianne Goosen4

Matthew Smith5

Andrew Bissett4

Jodie Van de Kamp4

Levente Bodrossy4

Mark Brown6

1 Climate Change Cluster, University of Technology, Sydney, Sydney, NSW, Australia
2 Australian Centre for Ecogenomics, University of Queensland, Brisbane, QLD, Australia
3 Department of Molecular Sciences, Macquarie University, Sydney, NSW, Australia
4 CSIRO Oceans and Atmosphere, Hobart, TAS, Australia
5 CSIRO, National Collections and Marine Infrastructure, Hobart, TAS, Australia
6 School of Environmental and Life Sciences, University of Newcastle, Callaghan, NSW, Australia

Key Information

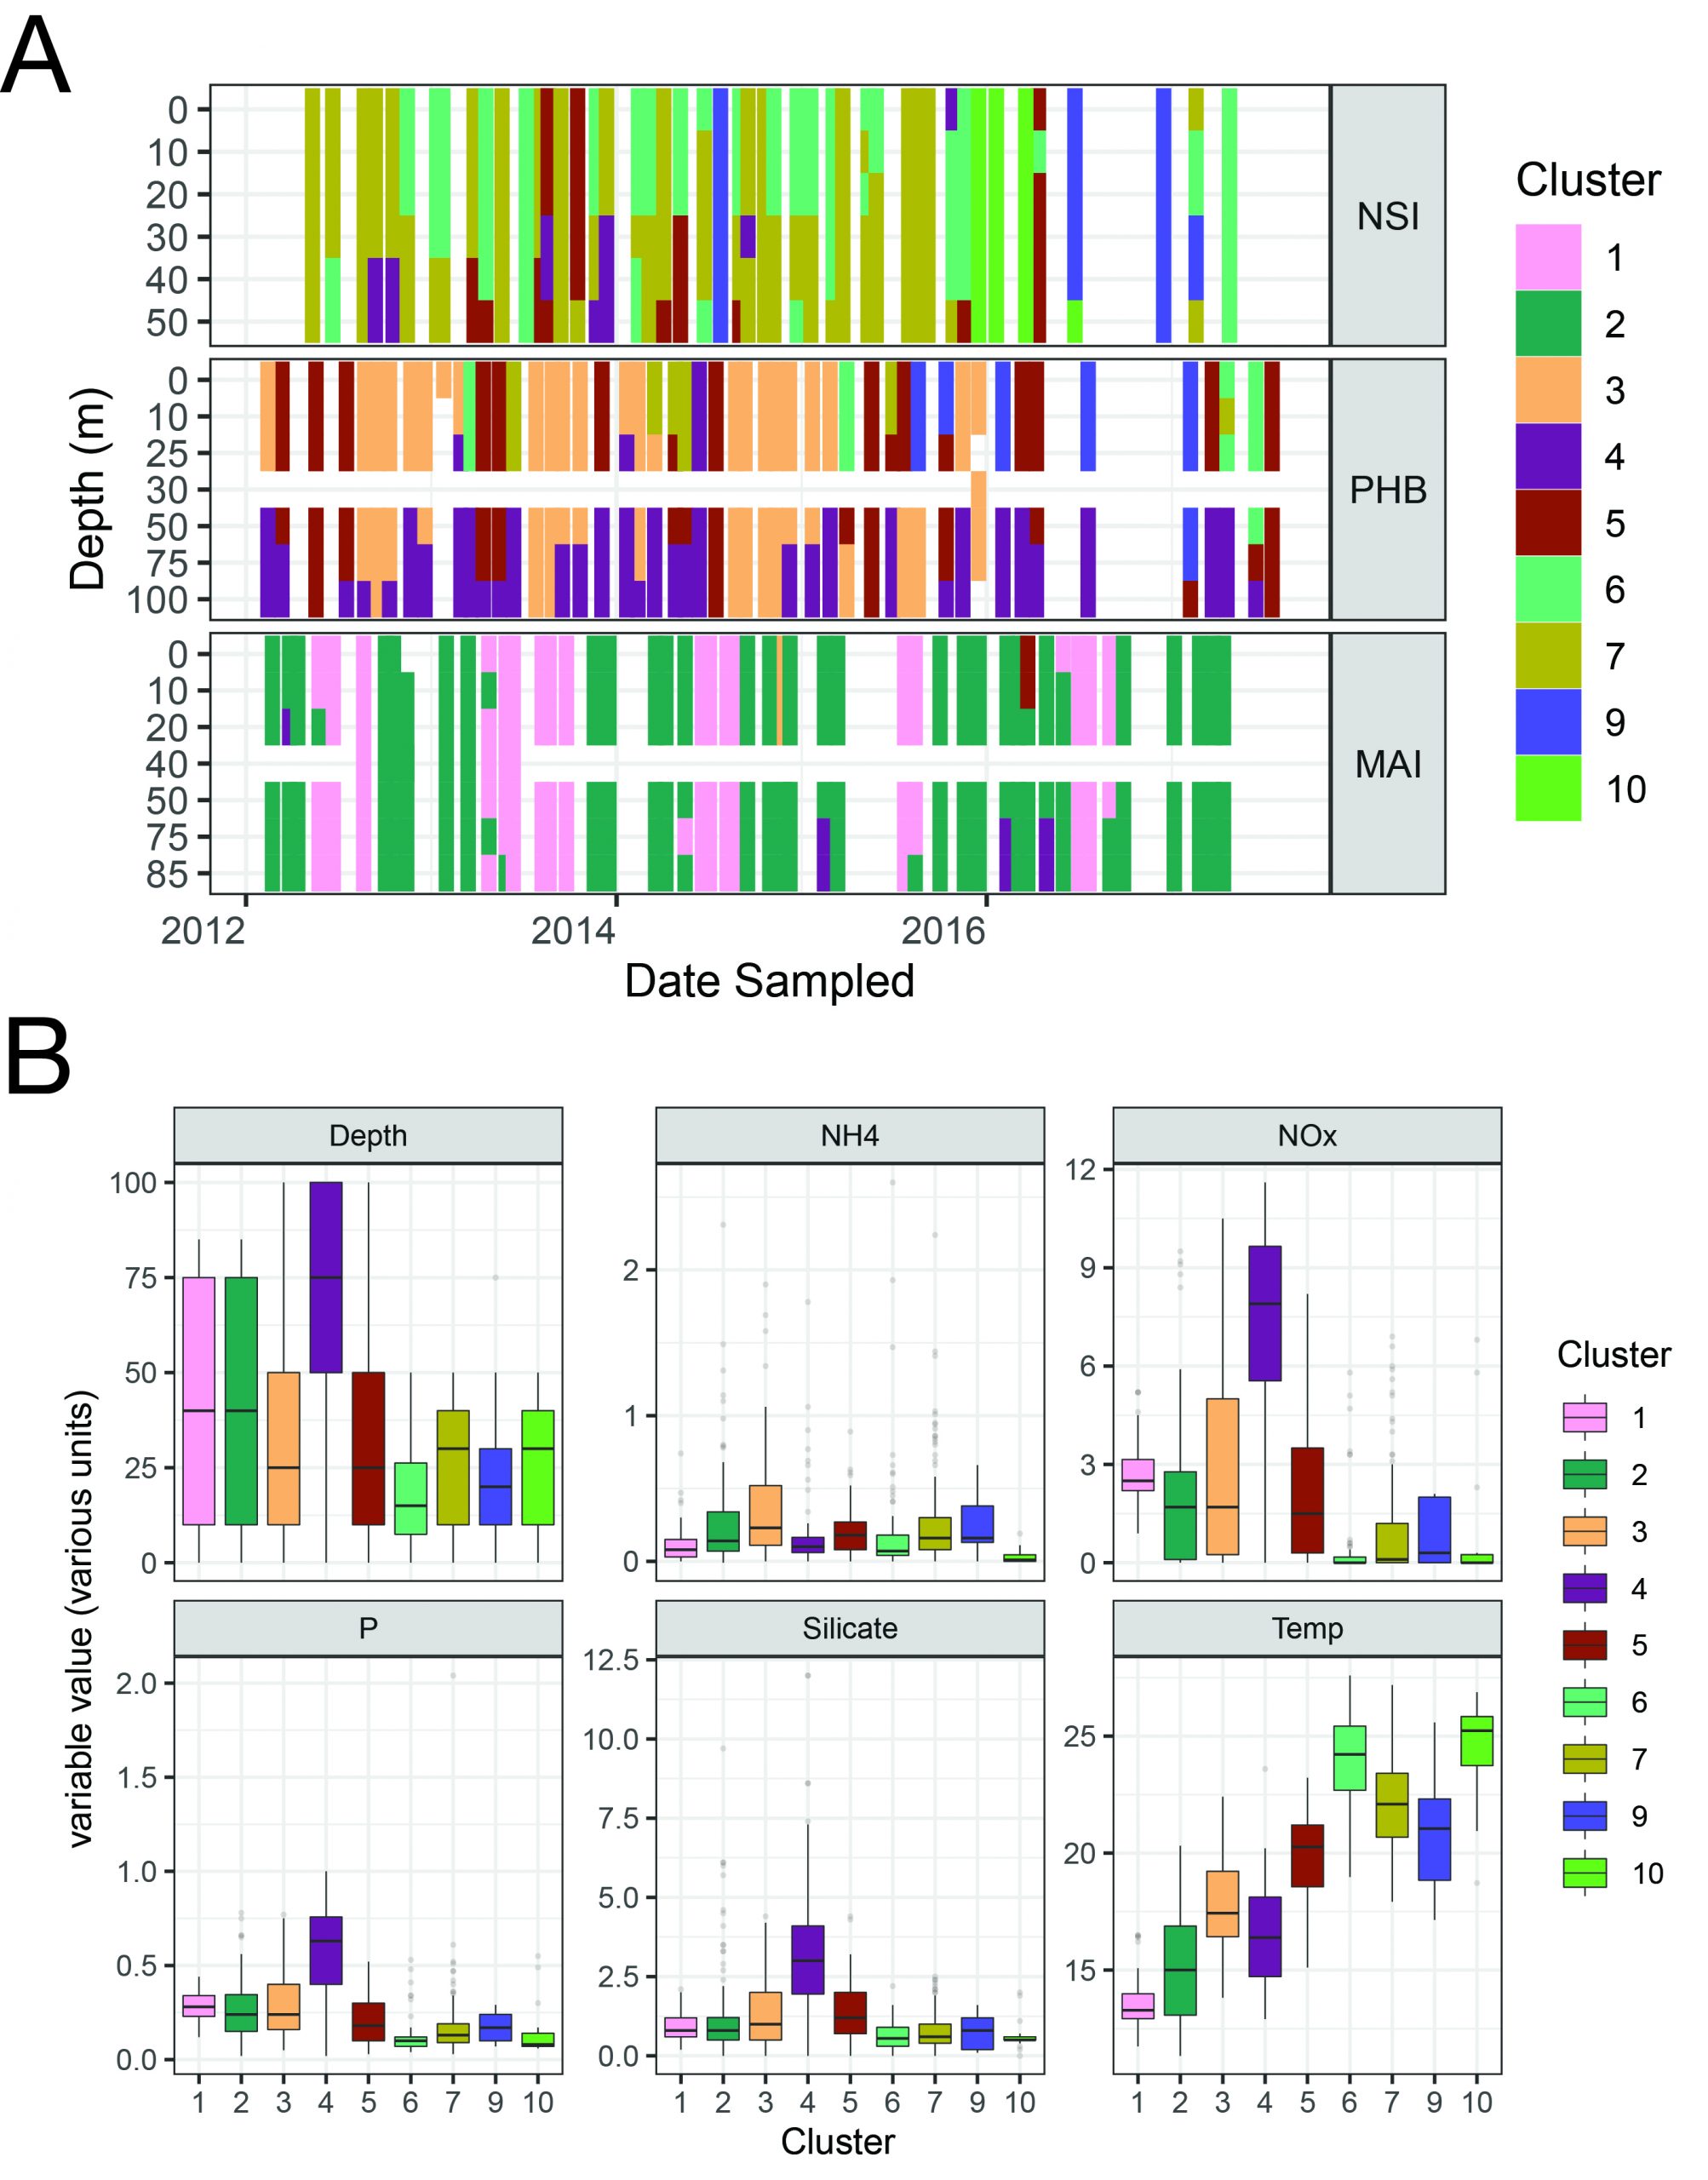
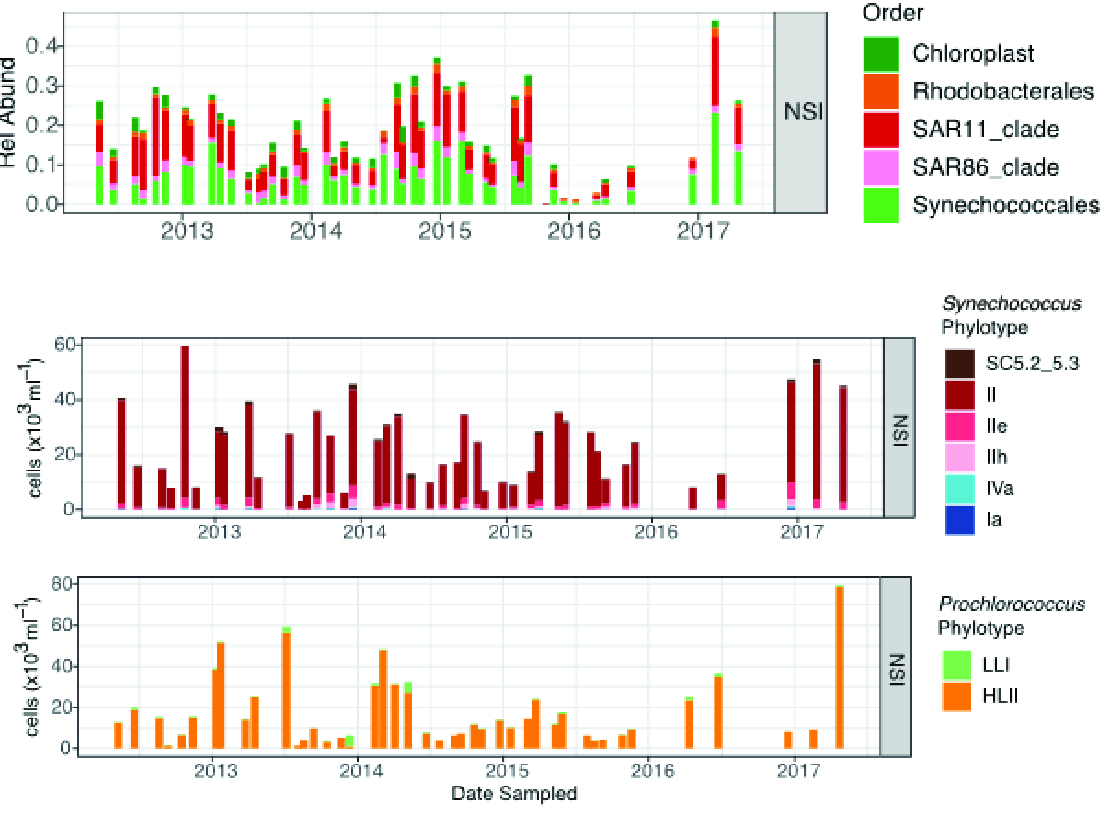
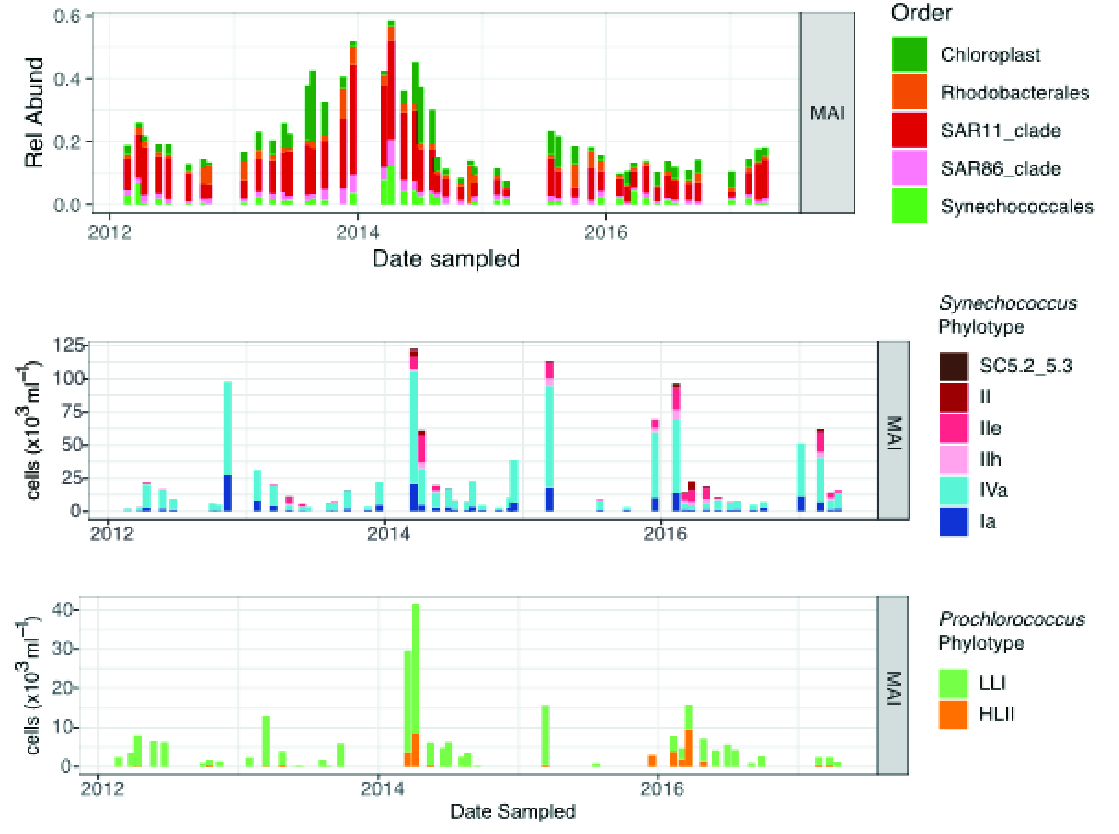
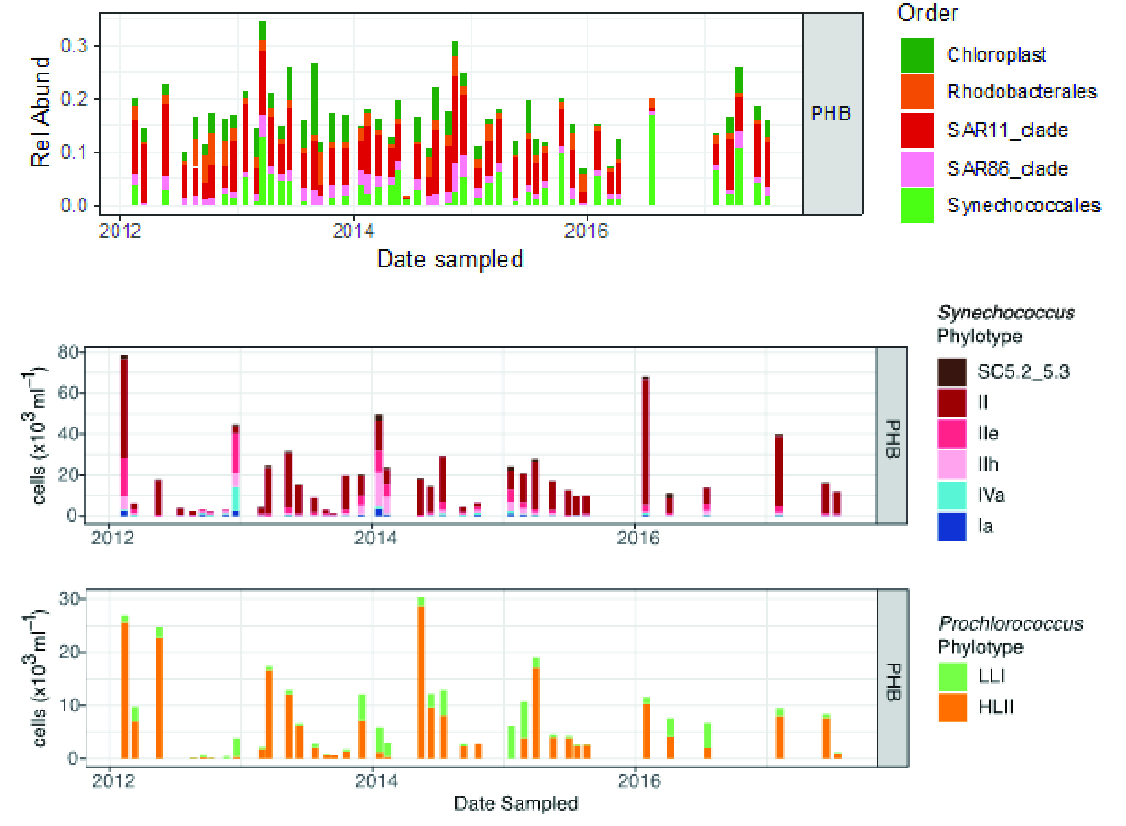
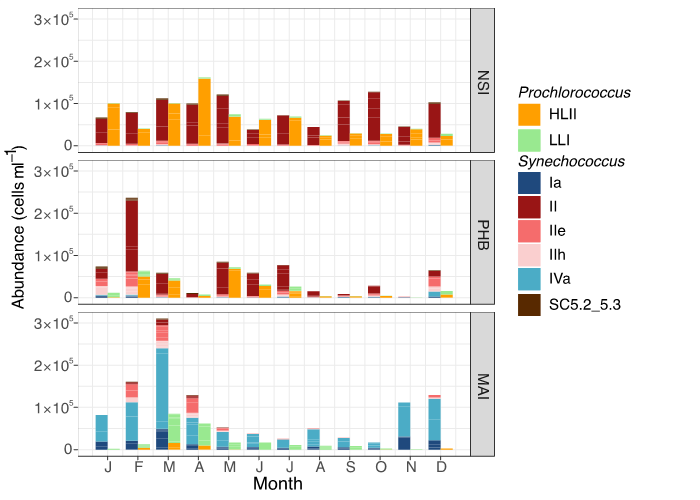
Using molecular approaches to monitoring microbial assemblages, we found that cyanobacterial microbes generally show less season and interannual variation in the subtropics compared to temperate waters. Synechococcus was found to increase and Prochlorococcus, decrease in abundance due to coastal upwelling at Port Hacking, highlighting the ability to interpret underlying changes in environment (nutrients, heat and light) from molecular microbial time series.

Keywords

Synechococcus, Prochlorococcus, cyanobacterial microbes, molecular tools

Status of Australian marine microbial assemblages

Despite being invisible to the naked eye, microbes have long been recognised as the planet’s consummate recyclers of dead and decaying matter (Azam, 1998). Their diverse metabolic activities contribute to the resupply of nutrients to the base of marine food webs, effectively repriming the production that sustains all Ocean life. This important, but narrow, view has expanded rapidly over the past four decades, leading to the realisation that microbes ‘drive global biogeochemical cycles’ (Falkowski, Fenchel, & DeLong, 2008). The vast numbers of microbes and their metabolic diversity has only recently been unveiled by a rapid expansion of molecular techniques, fuelled by advances in fluorescence and low-cost sequencing technologies. Numerous discoveries within this new dimension have fundamentally changed our understanding of how marine food webs function (Worden et al., 2015).

Here we use molecular tools to distinguish tiny, planktonic, single-celled bacteria, archaea and microbial eukaryotes that constitute 90% of all biomass in the ocean, but lack distinguishing external features. We analyse some of the sustained molecular observations from three Integrated Marine Observing System (IMOS) National Reference Stations since 2012, highlighting some of the time series of key microbial components and their dynamics. Observations span marker genes and metagenomes. Marker genes reveal the complex dynamics and interactions among three domains of life (archaea, bacteria and eukaryotes). Metagenomes provide additional insight into functional adaptations that underpin how individual single-celled microbes adapt to diverse marine environments.

We used the publicly available bacterial single nucleotide variant 16S rRNA gene sequence dataset from the Australian Microbiome Initiative (AMI) to observe the relative abundance of microbial taxa for the three longest time series at the IMOS National Reference Stations, viz., Maria Island, Port Hacking and North Stradbroke Island. The relative abundance of taxa was square-root transformed to reduce the dominance of abundant taxa in the analysis. The relationship among samples was visualised in two dimensions using non-metric multidimensional scaling and unsupervised clustering (simprof) based on the Bray-Curtis similarity measure of the microbial assemblage. Community structure was investigated using concomitant environmental data (see the AODN dataset “IMOS National Reference Station (NRS) - Salinity, Carbon, Alkalinity, Oxygen and Nutrients (Silicate, Ammonium, Nitrite/Nitrate, Phosphate”).

Photosynthetic populations detected in the 16S rRNA were analysed at the Order (Chloroplast and Cyanobacteria), and phylotype level (Synechococcus and Prochlorococcus) by assigning single nucleotide variants to ecologically-defined genotypes (Farrant et al., 2016; Mazard, Ostrowski, Partensky, & Scanlan, 2012). Where possible, proportions of each type were scaled to absolute abundances obtained from the AODN flow cytometry analyses (see Section “Picophytoplankton: harbingers of change in our coastal oceans” by Thomson et al.).

Discrete microbial assemblages inhabit each of the IMOS National Reference Stations (Figure 1, (Brown et al., 2018)), with several common abundant order-level taxonomic groups displaying different relative abundances that vary spatially, seasonally and interannually. Pelagibacteriales (SAR11), Rhodobacterales and SAR86 are the most abundant heterotrophic groups, constituting ~50% of the sequences from surface waters at each station. Phototrophic taxa include cyanobacteria as well as eukaryote phytoplankton (detected by the 16S rRNA gene in their chloroplasts) and their relative abundance provides important indicators to monitor changes in the dynamics of microbial primary production at each site.

North Stradbroke Island, Queensland

At the North Stradbroke Island National Reference Station, cyanobacteria are an order of magnitude more abundant than chloroplast sequences over time (Figure 2), indicating that prokaryotes may be the largest contributor to primary production in this region. At a higher taxonomic resolution, Synechococcus clade II and Prochlorococcus High-Light II (HLII) are the major components of the cyanobacteria and their genetic composition shows little variation seasonally or over time. Fluctuations in overall abundance of cyanobacteria may be linked to warmer temperatures and nutrients, which correspond to peaks in the abundance of Prochlorococcus and Synechococcus. Sequences of the keystone nitrogen-fixing cyanobacterium Trichodesmium spp. (not shown here) are sporadically detected in the data in low relative abundance (see Section “Spatial and seasonal trends in Trichodesmium” by Davies et al.).

Maria Island, Tasmania

The most southerly IMOS National Reference Station (Maria Island) has a higher proportion of chloroplast sequences, with picoeukaryote species Ostreococcus and Micromonas contributing most (Brown et al., 2018). At Maria Island, the relative proportion of chloroplasts peaks in winter, with their highest relative proportions in 2013 and 2014, representing up to 20% of all bacterial 16S sequences (Figure 3). The late-winter, early-spring peak in chloroplasts is followed by an increase in the abundance of the heterotrophic Rhodobacterales. This group is widespread in coastal and oceanic environments, displays diverse interactions with phytoplankton, and has metabolic capabilities associated with post-bloom recycling of organic matter (Moran et al., 2007). By contrast with northerly National Reference Stations, Synechococcus sub clade I and IV are the most abundant phylotypes at Maria Island, and their abundance peaks in February/March each year, reaching similar numbers as observed in the sub-tropical National Reference Stations. Seasonally, Synechococcus steadily increases from November and declines from April, with the appearance of the subtropical clade II and IIe phylotypes as distinct markers of the influence of warmer sea surface temperatures, and potentially indicators of the southerly extension of the East Australia Current.

Port Hacking, New South Wales

The composition of communities at the Port Hacking National Reference Station varies considerably over time, reflecting the complex oceanography at this site. For example, the elevated abundance of Prochlorococcus is closely coupled to the influence of the East Australian Current (Figure 4). The sub-tropical Synechococcus clade II is the most abundant. However, the episodic appearance of phylotypes (IIe and IIh), hypothesised to represent lineages adapted to the intermediate conditions found at the boundaries between water masses at Maria Island, and the inverse at Port Hacking, highlight the presence of a major ecological transition between subtropical and temperate communities in this region. Appearances of the temperate Synechococcus clades (I and IV) are correlated with a decrease of Prochlorococcus HLII and appear to indicate coastal upwelling (see Section “Picophytoplankton: harbingers of change in our coastal oceans” by Thomson et al.).

We show that molecular approaches can now be used to monitor changes in key species; here we focused on cyanobacterial primary producers. This is an important group, because many of these are small and not visible with light microscopy (e.g., Prochlorococchus, Synecococchus) or have cryptic species (Trichodesmium). Procholorococcus and Synechococcus are the most abundant photosynthetic species in the ocean, responsible for ~25% of all primary production in the ocean, and their numbers are predicted to change substantially over the next decades in response to climate change (Flombaum et al., 2013).

For the cyanobacterial microbes investigated here, there was generally less seasonality in subtropical waters (North Stradbroke Island) than in temperate waters (Maria Island) (Figure 5). Similar to the seasonality, the interannual variation of most clades was lower in the subtropics (North Stradbroke Island) than in cooler regions (Maria Island and Port Hacking). We found that at Port Hacking, molecular data suggest that strains of Synechococcus increase in abundance and those of Prochlorococcus decrease in response to coastal upwelling.

Microbes are the primary biological determinants of ocean health and the first responders to ecosystem change. The high-resolution dataset housed at the Australian Microbiome Initiative describes seasonal and interannual marine microbial diversity and dynamics across the seven IMOS National Reference Stations and the greater southern hemisphere region. This dataset provides a valuable baseline against which changes in microbial assemblages in response to climate change can be assessed.

The use of molecular tools to generate time series and their use in ecosystem assessments is still in its infancy. The recent establishment of the microbe facility within IMOS will facilitate the development of novel tools to monitor, forecast and sustainably manage marine resources. Ongoing observations will help document shifts in distributions of organisms, which result from changes in ocean currents (e.g., East Australia Current dynamics), basin-scale climatic events, or climate change. In particular, a number of species associated with harmful algal blooms are detected within the microbial data (Alexandrium, Noctiluca and Gymnodinium), which highlights the potential to enhance understanding of bloom dynamics within the context of a holistic record of microbial community structure (Brown et al., 2018).

Sustained temporal observations of microbial dynamics in Australian waters was formally established through an IMOS partnership with the Australian marine microbiology community in 2012, with the establishment of the Australian Marine Microbial Biodiversity Initiative (AMMBI). Data and protocols from this project have recently become an integral part of the Australian Microbiome Initiative (https://www.australianmicrobiome.com/) (AMI). This initiative draws core funding from IMOS, Bioplatforms Australia, CSIRO and Parks Australia. AMI provides publicly available, methodologically standardised, continental scale, phylogenetic amplicon and metagenomic sequencing data describing the temporal and spatial dynamics of bacteria, archaea and microbial eukarya assemblages in Australian, and more broadly, southern hemisphere waters ranging the Antarctic ice edge to the equator.

As part of the IMOS National reference Station facility, samples for microbial analysis are collected from seven IMOS NRS: Darwin Harbour (Northern Territory; depths 0, 10, 20 m), Yongala (Queensland; depths 0, 10, 20, 26 m), North Stradbroke Island (Queensland; depths 0, 10, 20, 30, 40, 50 m), Rottnest Island (Western Australia; depths 0, 10, 20, 30, 40, 46 m), Port Hacking (New South Wales; depths 0, 10, 25, 50, 75, 100 m), Kangaroo Island (South Australia; depths 0, 10, 20, 50, 75, 100 m), Maria Island (Tasmania; depths 0, 10, 20, 50, 75, 85 m). Oceanographic samples have been collected during Marine National Facility (MNF) supported voyages on the RV Southern Surveyor, RV Investigator and the RV Aurora Australis. The current AMI pelagic marine dataset contains data from 3381 samples and describes microbial assemblages in the southern hemisphere from Latitudes 0 to 66.3S, temperatures -1.6 and 31.4 and depths 0 to 6,015 m.

Further, metagenomic datasets are generated from a subset of these samples. This method involves the sequencing of random fragments of DNA from a sample to provide a snapshot of functional genetic diversity. Metagenomic data is parsed into taxonomic marker gene tables and functional gene-abundance tables, and also enables the targeted reconstruction of population genomes of specific, potentially uncultivated taxa.

All data are housed at the National Centre for Biotechnology Information under bioproject PRJNA385736 and also through the AMI data portal (https://data.bioplatforms.com/organization/about/australian-microbiome).

To allow for the highest possible flexibility for users, the AMI provides searchable, fully processed amplicon data in the form of single nucleotide variants, partially-processed data in the form of a unique sequences table, and unprocessed data in the form paired end read (R1, R2) and indexed read (I1, I2) data in .fastq. It is important to note that due to the methods used, which are current best practice, including multiplexing of samples, different data formats may be more suitable or desirable to users asking different scientific questions.

Azam, F. (1998). Microbial control of oceanic carbon flux: The plot thickens. Science, 280(5364), 694-696. doi:10.1126/science.280.5364.694

Brown, M. V., van de Kamp, J., Ostrowski, M., Seymour, J. R., Ingleton, T., Messer, L. F., . . . Bodrossy, L. (2018). Data Descriptor: Systematic, continental scale temporal monitoring of marine pelagic microbiota by the Australian Marine Microbial Biodiversity Initiative. Scientific Data, 5. doi:10.1038/sdata.2018.130

Falkowski, P. G., Fenchel, T., & DeLong, E. F. (2008). The microbial engines that drive earth Biogeochemical Cycles, 3, 1034-1040.

Farrant, G. K., Dore, H., Cornejo-Castillo, F. M., Partensky, F., Ratin, M., Ostrowski, M., . . . Garczarek, L. (2016). Delineating ecologically significant taxonomic units from global patterns of marine picocyanobacteria. Proceedings of the National Academy of Sciences of the United States of America, 113(24), E3365-E3374. doi:10.1073/pnas.1524865113

Flombaum, P., Gallegos, J. L., Gordillo, R. A., Rincon, J., Zabala, L. L., Jiao, N. A. Z., . . . Martiny, A. C. (2013). Present and future global distributions of the marine Cyanobacteria Prochlorococcus and Synechococcus. Proceedings of the National Academy of Sciences of the United States of America, 110(24), 9824-9829. doi:10.1073/pnas.1307701110

Mazard, S., Ostrowski, M., Partensky, F., & Scanlan, D. J. (2012). Multi-locus sequence analysis, taxonomic resolution and biogeography of marine Synechococcus. Environmental Microbiology, 14(2), 372-386. doi:10.1111/j.1462-2920.2011.02514.x

Moran, M. A., Belas, R., Schell, M. A., González, J. M., Sun, F., Sun, S., . . . A., B. (2007). Ecological genomics of marine roseobacters. Applied and Environmental Microbiology 73(14).

Worden, A. Z., Follows, M. J., Giovannoni, S. J., Wilken, S., Zimmerman, A. E., & Keeling, P. J. (2015). Rethinking the marine carbon cycle: factoring in the multifarious lifestyles of microbes. Science, 347(6223).


Figure 1

Temporal changes in microbial assemblages at three IMOS National Reference Stations: North Stradbroke Island, Port Hacking and Maria Island. A. Microbial communities were classified by hierarchal clustering (Bray-Curtis distance) and the distribution of nine distinct types were plotted over time at each of the depths sampled. B. The relationship between each community type and physico-chemical conditions at the time of sampling. Abbreviations and units. NH4: Ammonium (µmol L-1); NOx: Nitrate plus Nitrite (µmol L-1); P: Phosphate (µmol L-1), Silicate (µmol L-1), Temperature (˚C).

Figure 2

North Stradbroke Island NRS relative abundances of eukaryote (Chloroplast) and prokaryote (Synechococales) sequences grouped at the Order level. Abundances of Synechococcus and Prochlorococcus phylotypes. (note different Y axes, which were scaled to absolute counts by comparison with flow cytometry data).

Figure 3

IMOS Maria Island NRS Relative abundances of eukaryote (Chloroplast) and prokaryote (Synechococales) sequences grouped at the Order level. Abundances of Synechococcus and Prochlorococcus phylotypes. Also shown are the (note different Y axes, which were scaled to absolute counts by comparison with flow cytometry data).

Figure 4

Port Hacking NRS abundances of eukaryote (Chloroplast) and prokaryote (Synechococales) sequences grouped at the Order level. Abundances of Synechococcus and Prochlorococcus phylotypes (note different Y axes, which were scaled to absolute counts by comparison with flow cytometry data).

Figure 5

Seasonal abundances of Synechococcus and Prochlorococcus phylotypes at the IMOS five IMOS National Reference Stations.

Download this Time Series Report

Citing this report: 

Ostrowski M, Seymour J, Messer L, Varkey D, Goosen K, Smith M, Bissett A, Van de Kamp J, Bodrossy L, Brown M. (2020). Status of Australian marine microbial assemblages. In Richardson A.J, Eriksen R, Moltmann T, Hodgson-Johnston I, Wallis J.R. (Eds). State and Trends of Australia’s Ocean Report. doi: 10.26198/5e16aa3e49e7f

doi: 10.26198/5e16aa3e49e7f

Access the Data

Access the data that contributes to this time-series by clicking the icons below

06f. National Reference stations-02

National Reference Stations

Citing the Report

Richardson A.J, Eriksen R, Moltmann T, Hodgson-Johnston I, Wallis J.R. (2020). State and Trends of Australia’s Ocean Report, Integrated Marine Observing System (IMOS).

IMOS_logo-stacked-reversed-01

The State and Trends of Australia's Ocean Report was supported by IMOS. IMOS gratefully acknowledges the additional support provided by the Commonwealth Scientific and Industrial Research Organisation (CSIRO).

The State and Trends of Australia's Ocean website is maintained by IMOS.


NCRIS-PROVIDER-REV

Australia’s Integrated Marine Observing System (IMOS) is enabled by the National Collaborative Research Infrastructure Strategy (NCRIS). It is operated by a consortium of institutions as an unincorporated joint venture, with the University of Tasmania as Lead Agent.

Disclaimer:

You accept all risks and responsibility for losses, damages, costs and other consequences resulting directly or indirectly from using this site and any information or material available from it. While the Integrated Marine Observing System (IMOS) has taken reasonable steps to ensure that the information on this website and related publication is correct, it provides no warranty or guarantee that information provided by the authors is accurate, complete or up-to-date. IMOS does not accept any responsibility or liability for any actions taken as a result of, or in reliance on, information on its website or publication. Users should check with the originating authors to confirm the accuracy of the information before taking any action in reliance on that information.

If you believe any information on this website or in the related publication is inaccurate, out of date or misleading, please bring it to our attention by contacting the authors directly or emailing us at IMOS@imos.org.au


Images and Information:

All information on this website remains the property of those who authored it. All images on this website are licensed through Adobe Stock, Shutterstock, or have permission from the original owner.