Biological Time Series - Marine Animals

4.1

The response of the copepod community to long-term warming along the east coast of Australia

Contributors

Anthony J. Richardson1,2

Claire Davies3

Ruth Eriksen3

1 CSIRO Oceans and Atmosphere, Queensland Biosciences Precinct (QBP), St Lucia, QLD, Australia
2 Centre for Applications in Natural Resource Mathematics (CARM), School of Mathematics and Physics, The University of Queensland, St Lucia, QLD, Australia
3 CSIRO Oceans and Atmosphere, Hobart, TAS, Australia

Key Information

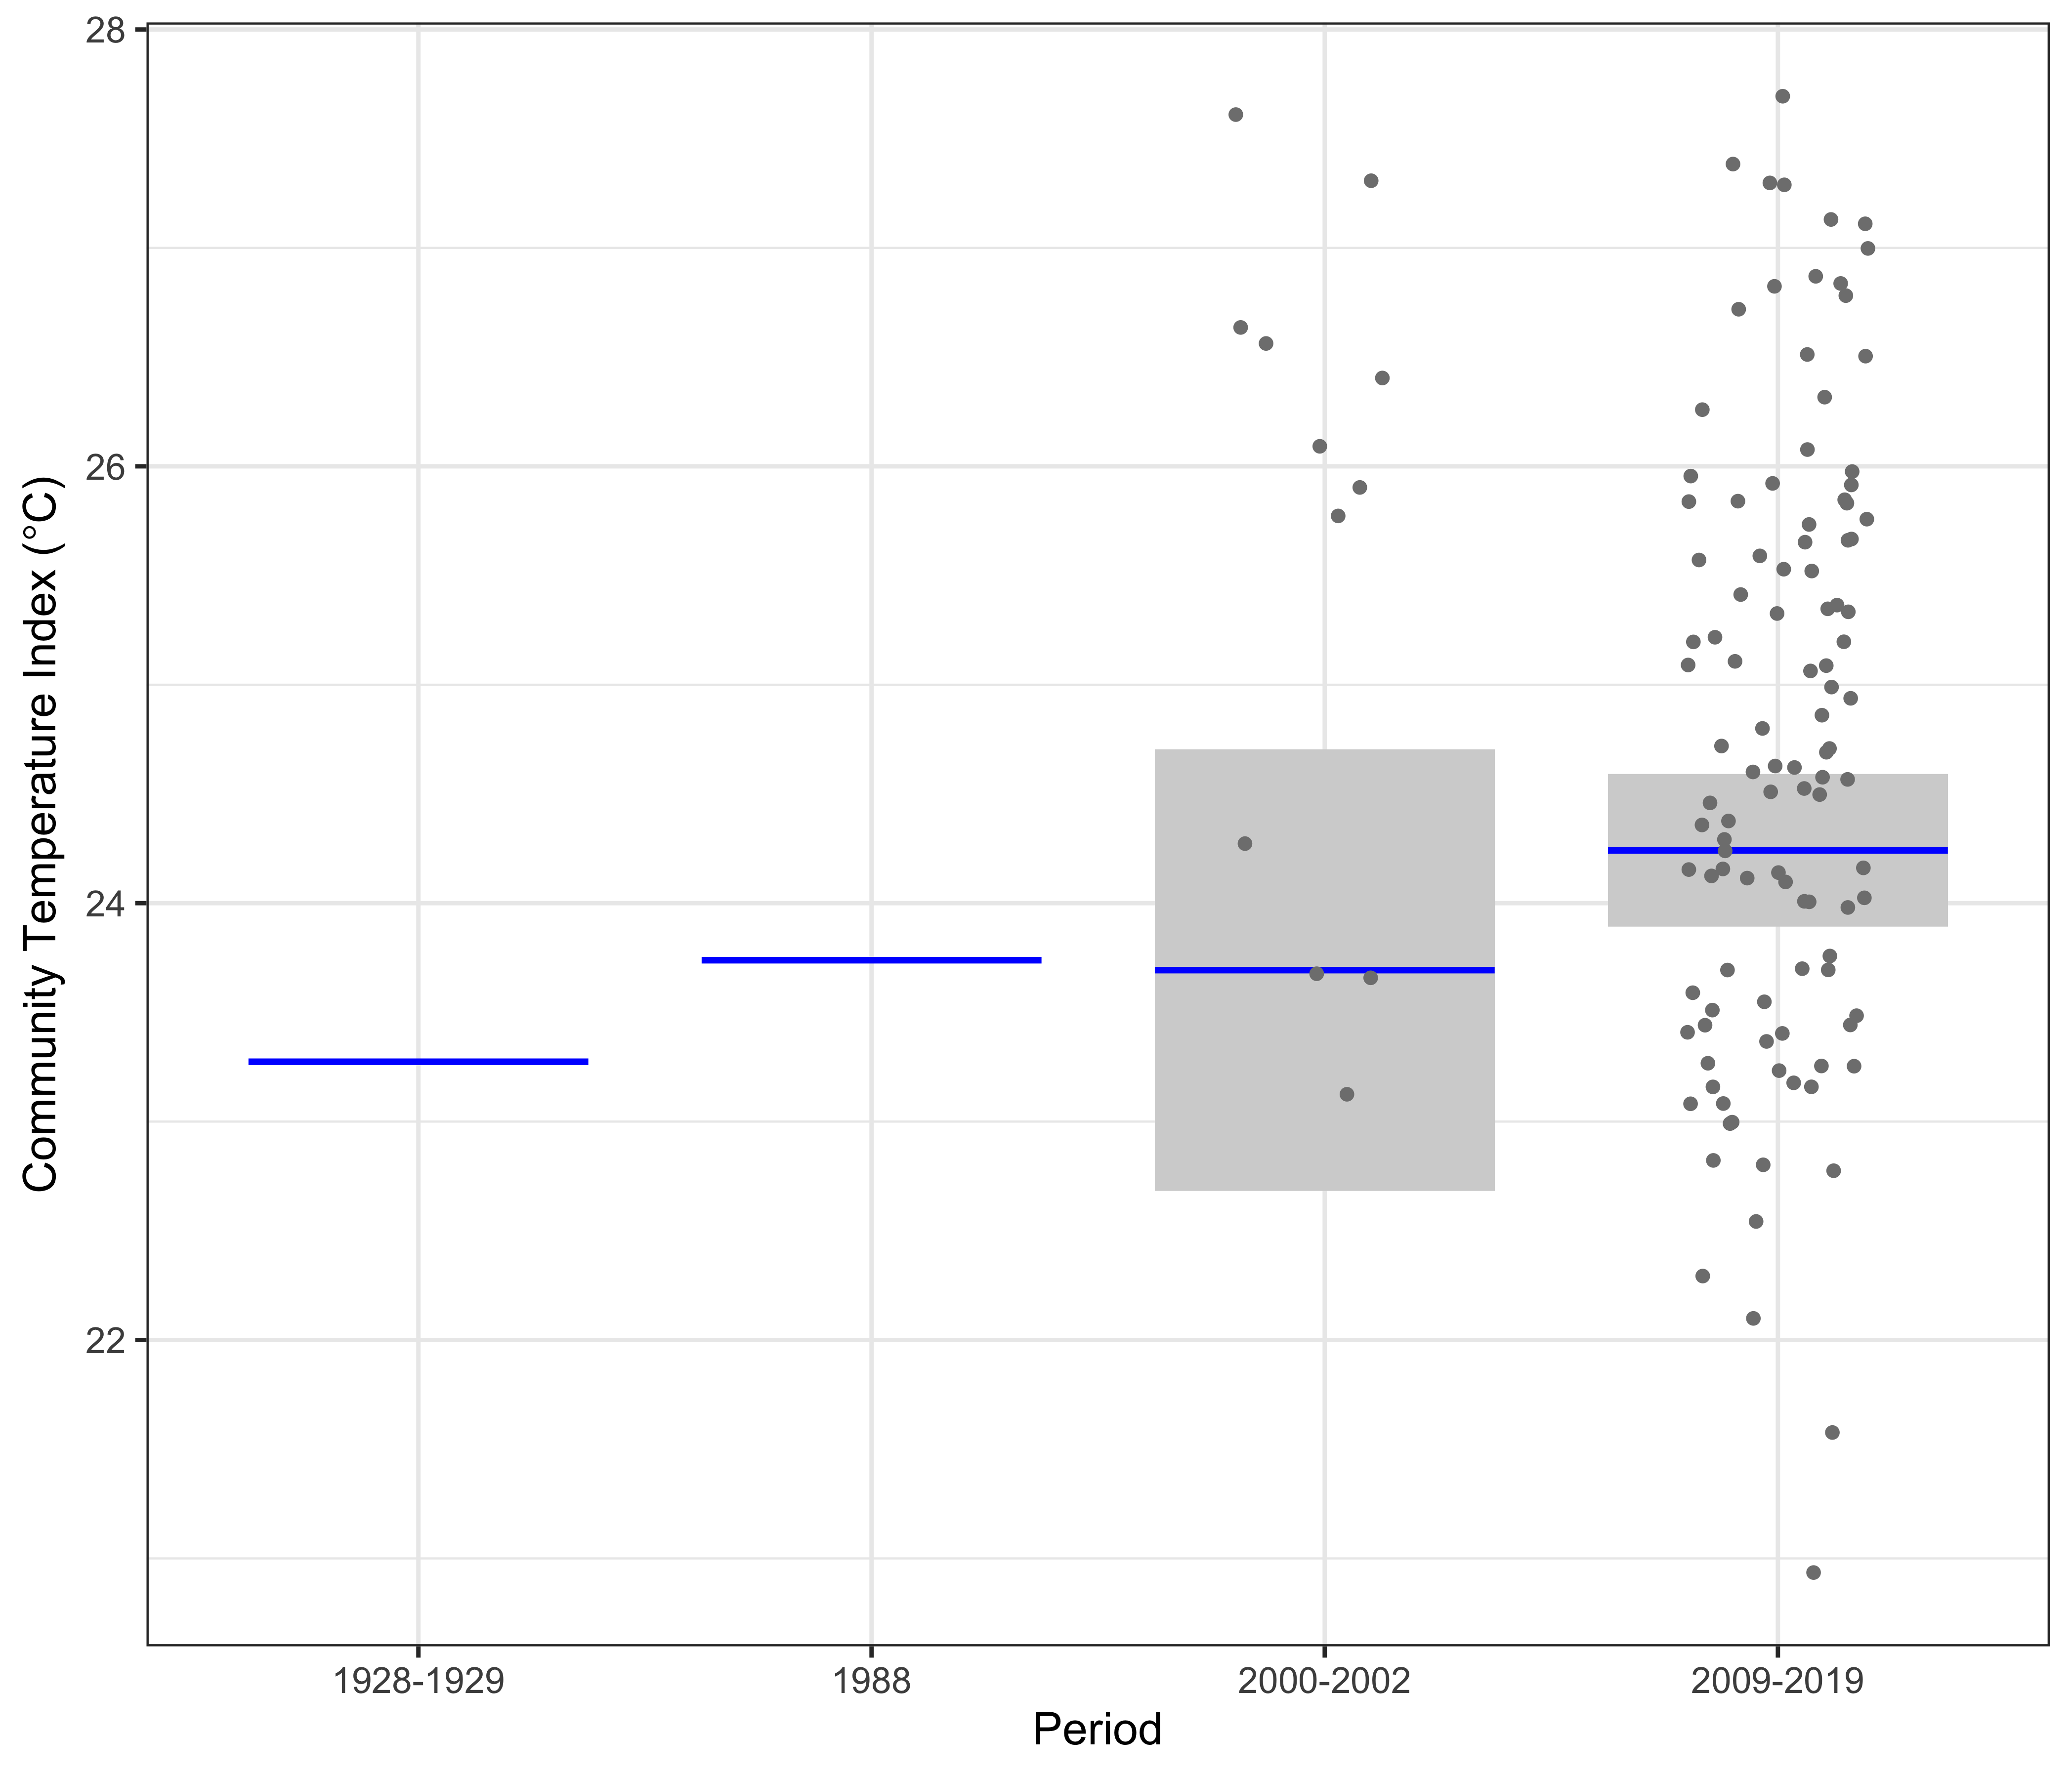
Warmer-water copepod species down Australia’s east coast (at Maria Island, Port Hacking and Yongala) are now more common compared with the community 50-100 years ago. Warm-water copepods are generally smaller and lighter and are thus a poor food source for fish, seabirds and marine mammals.


Keywords

Community Temperature Index (CTI), East Coast of Australia, copepod abundance, climate change

The response of the copepod community to long-term warming along the east coast of Australia

Copepods, the most abundant zooplankton, are sensitive indicators of climate change, as temperature regulates their physiology and influences their interactions with other species (Richardson, 2008). Ultimately, warmer temperatures alter species’ ranges, timing of blooms, diversity, composition, and size structure. Examples of poleward movement of species (Beaugrand et al., 2002), earlier timing (Edwards & Richardson, 2004), higher diversity (Richardson, 2008), change toward a community that prefers warmer waters (Poloczanska et al., 2013) and smaller species (Campbell, 2018) have been described in many areas in the northern hemisphere with long-term datasets, but there are few examples from Australian waters. Now we have over ten years of zooplankton data from the Integrated Marine Observing System (IMOS) National Reference Stations, we can start to explore how climate change might be impacting Australian zooplankton communities.

Surface waters off the east coast of Australia have warmed by up to 2°C over the past 70 years, with greater warming in the south (e.g., Maria Island) than further north (e.g., Port Hacking) (Figure 1). This is a consequence of global warming and its influence on the intensification of the poleward-flowing East Australian Current (EAC) (Cai et al., 2005), which is distributing more warm-water to southern Australia (Ridgway, 2007). This increasing strength of the EAC has contributed to ocean warming off southeast Australia ~3–4 times the global average (Ridgway, 2007).

Here we compare the IMOS copepod data from three National Reference Stations in eastern Australia – Maria Island (42.6°S), Port Hacking (34.1°S) and Yongala (19.3°S). We chose these regions because there was historical zooplankton data in each region to assess whether there is a signature of warming in the copepod community.

To investigate whether warming has impacted the copepod community, we compared the preferred temperature of copepods from historical samples to that from recent samples using the Community Temperature Index (CTI) (Stuart-Smith et al., 2015). The CTI is the overall temperature preference of species in a sample, weighted by their abundance, so that more abundant species have greater influence. It has been used to assess the temperature preference of communities of microbes, butterflies, fish and benthic invertebrates (Stuart-Smith et al., 2015 and references therein). We chose the CTI because it is sensitive to large-scale changes in temperature and is relatively robust to variations in sampling methods, as it is most responsive to relative and not absolute changes in abundance.

We performed three separate analyses – one for Maria Island, one for Port Hacking, and one for Yongala. All analyses compare current IMOS data with historical data from the Australian Zooplankton Database (Davies et al., 2014). For Port Hacking, IMOS samples from 2009-2018 were compared with two historical datasets. The first was 29 samples collected monthly from January 1931 to March 1932 by Dakin & Colefax (1940). The second was more recent; 71 samples were collected monthly from 2001-2008 (by the NSW Environment Agency). The 2001-2008 data were counted in the same way and by the same people as the 2009-2018 IMOS (104 samples). Only the most abundant 15 species were reported historically from 1931-1932, so these same species were extracted from the more recent data for comparison using the CTI.

For Maria Island, the historical dataset was collected monthly from August 1971 to May 1973 over a grid off the east coast of Tasmania by Nyan Taw (1975). We retained samples in our analysis that were within 150 km of Maria Island and <200 m depth to ensure similar conditions to the current IMOS National Reference Station. We then compared these data with IMOS data collected from January 2009 to the present. As the 1971-1973 data included only 25 copepod species, we selected the same species from the 2009-2018 period. For Yongala, we use copepod data the 1928-1929 GBR expedition (Farran, 1949), Peter Liston’s PhD thesis (Liston, 1990), sampling in the early 2000s (Mckinnon et al. 2005), and IMOS data since 2009.

To estimate the preferred temperature for each of the copepod species in the analyses, we used data on the abundance of copepods from 20,000 samples collected as part of the IMOS National Reference Stations, the Australian Continuous Plankton Recorder survey, and the Southern Ocean Continuous Plankton Recorder survey (Eriksen et al., 2019; Hosie et al., 2003). We assigned each sample a temperature based on a weekly composite from remote sensing data, and plotted the abundance of each species vs temperature in 0.5°C temperature bands and fitted kernel density models (Figure 2). The preferred temperature for each species is called the species temperature index and is defined as the temperature of maximum abundance (Stuart-Smith et al. 2015).
To calculate the CTI for each sample (i.e., the overall temperature preference of the copepods in a sample), we multiplied the abundance of each species by its thermal preference (i.e., species temperature index), and divided by the total abundance of these species in the sample (Stuart-Smith et al. 2015). As the same species are used to compare with historical and current data, any changes in the CTI are due to the relative changes in abundance of cold and warm-water species, and not to the influx of new warm-water species. This is a cautious approach, as it is less biased by differences in the ability to sample and identify rare species.
The last part of the analysis was to use a linear model to test whether there had been an increase in the CTI fover time as the waters are warming. We adjusted for the seasonal cycle in the analysis by including Month in the linear model. Historical data were sourced from the “The Australian Zooplankton Database” (Davies et al. 2014; data available at https://figshare.com/articles/Data_Paper_Data_Paper/3560811). Recent data (from IMOS) were sourced from the AODN (dataset “IMOS National Reference Station (NRS) - Zooplankton Abundance”).

Copepod species at Port Hacking and Maria Island have a range of thermal preferences, with some preferring colder waters and some warmer waters (Figure 2). As expected, species from Port Hacking (Figure 2a) generally have warmer temperature preferences than those from Maria Island (Figure 2b).

At Port Hacking, the linear model clearly showed a significant increase in the CTI of 1.5°C from 1931-1932 to 2001-2008, and then a further increase of 0.9°C to 2009-2018 (r2=35.9%, Figure 3). This increase in CTI is similar in magnitude to the warming since the 1930s, and implies that warm-water copepod species have increased in abundance whilst cold-water copepods have decreased. The increase in CTI is accompanied by some samples having extremely warm-water affinities with CTIs around 26°C, about 6°C warmer than the warmest communities observed in 1931-1932. There was a clear seasonal cycle in CTI at Port Hacking, with highest values in July-September, and lowest values in November-January.

At Maria Island, the linear model clearly showed a significant increase in the CTI of 1.6°C from 1971-1973 to 2009-2018 (r2=47.7%, Figure 4). This increase in CTI is similar in magnitude to the warming over the same period, and implies that warm-water copepod species have increased in abundance whilst cold-water copepods have decreased. There was a clear seasonal cycle in CTI, with highest values in March-June, and lowest values in October and November. The very low values of CTI (~12.5°C) seen in October and November in the 1970s (spring) is a consequence of high abundances of a single species – Neocalanus tonsus, a large cold-water copepod indicative of intrusions of Southern Ocean water. Despite nearly 10 years of monthly IMOS sampling since 2009, we have not seen Neocalanus tonsus in similar large numbers at Maria Island, potentially because of the increased flow of the EAC and reduced incursions of Southern Ocean water in the region.

At Yongala, the linear model clearly showed a significant increase in the CTI of nearly 1°C from 1928-1929 to 2009-2019 (Figure 4). This is similar to the 0.75°C warming observed in the region, based on Hadley ISST data from the UK Met Office. Data from two surveys – one in 1988 and the other 2000-2002 show intermediate values of CTI.

This is the strongest evidence to date that global warming is affecting zooplankton composition in response to warming in Australian waters. The increased abundance of warm-water taxa is consistent with what is happening in other systems including the North Atlantic (Beaugrand et al., 2002; Bonnet et al., 2005; Lindley & Daykin, 2005) and North Pacific (Poloczanska et al., 2013). Such a change from cold- to warm-water zooplankton species off southeast Australia is likely to have repercussions for higher trophic levels. Warm-water copepod communities generally have smaller individuals and lower biomass (Richardson & Schoeman, 2004) and are thus inferior food for fish, seabirds and marine mammals (Beaugrand et al., 2003). Ongoing IMOS observations of zooplankton ensure we are well placed to identify future changes in the zooplankton community around Australia.

Beaugrand, G., Reid, P. C., Ibanez, F., Lindley, J. A., & Edwards, M. (2002). Reorganization of North Atlantic marine copepod biodiversity and climate. Science, 296(5573), 1692-1694. Retrieved from <Go to ISI>://000175976200060

Beaugrand, G., Souissi, S., Reid, P. C., Brander, K. M., & Alistair Lindley, J. (2003). Plankton effect on cod recruitment in the North Sea. Nature, 426(6967), 661-664.

Bonnet, D., Richardson, A., Harris, R., Hirst, A., Beaugrand, G., Edwards, M., . . . Fernandez de Puelles, M. L. (2005). An overview of Calanus helgolandicus ecology in European waters. Progress in Oceanography, 65(1), 1-53. doi: 10.1016/j.pocean.2005.02.002

Cai, W., Shi, G., Cowan, T., Bi, D., & Ribbe, J. (2005). The response of the Southern Annular Mode, the East Australian Current, and the southern mid-latitude ocean circulation to global warming. Geophysical Research Letters, 32(23). doi: L2370610.1029/2005gl024701

Campbell, M. (2018). Testing macroecological patterns that drive community structure using zooplankton in the global ocean. (Honours thesis). University of Queensland.

Dakin, W. J., & Colefax, A. (1940). The plankton of the Australian coastal waters off New South Wales Part I. Publications of the University of Sydney, 210.

Davies, C. H., Armstrong, A. J., Baird, M., Coman, F., Edgar, S., Gaughan, D., . . . Richardson, A. J. (2014). Over 75 years of zooplankton data from Australia. Ecology, 95(11), 3229-3229. doi:10.1890/14-0697.1

Edwards, M., & Richardson, A. J. (2004). Impact of climate change on marine pelagic phenology and trophic mismatch. Nature, 430(7002), 881-884. doi: 10.1038/nature02808

Eriksen, R. S., Davies, C. H., Bonham, P., Coman, F. E., Edgar, S., McEnnulty, F., . . . Richardson, A. J. (2019). Australia’s long-term plankton observations: the Integrated Marine Observing System National Reference Station network. Frontiers in Marine Science, 6(Article 161), 17.

Farran, G. P. (1949). The seasonal and vertical distribution of the copepoda. In Scientific Reports (Vol. Great Barrier Reef Expedition 1928 - 1929 Volume 2).

Hosie, G. W., Fukuchi, M., & Kawaguchi, S. (2003). Development of the Southern Ocean Continuous Plankton Recorder survey. Progress in Oceanography, 58(2-4), 263-283. doi: 10.1016/j.pocean.2003.08.007

Lindley, J. A., & Daykin, S. (2005). Variations in the distributions of Centropages chierchiae and Temora stylifera (Copepoda: Calanoida) in the north-eastern Atlantic Ocean and western European shelf waters. ICES Journal of Marine Science, 62(5), 869-877. doi: 10.1016/j.icesjms.2005.02.009

Liston, P. W. (1990). Spatial variability and covariability of chlorophyll and zooplanktn on the Great Barrier Reef. (PhD). James ook University,

Mckinnon, A. D., Duggan, S., & De'ath, G. (2005). Mesozooplankton dynamics in nearshore waters of the Great Barrier Reef. Estuarine, Coastal and Shelf Science, 63(4), 497-511. doi: 10.1016/j.ecss.2004.12.011

Poloczanska, E. S., Brown, C. J., Sydeman, W. J., Kiessling, W., Schoeman, D. S., Moore, P. J., . . . Richardson, A. J. (2013). Global imprint of climate change on marine life. Nature Climate Change, 3, 919. doi:10.1038/nclimate1958

Richardson, A. J. (2008). In hot water: zooplankton and climate change. ICES Journal of Marine Science, 65(3), 279-295. doi:10.1093/icesjms/fsn028

Richardson, A. J., & Schoeman, D. S. (2004). Climate impact on plankton ecosystems in the northeast Atlantic. Science, 305(5690), 1609-1612. doi:10.1126/science.1100958

Ridgway, K. R. (2007). Long-term trend and decadal variability of the southward penetration of the East Australian Current. Geophysical Research Letters, 34(13). doi:10.1029/2007gl030393

Stuart-Smith, R. D., Edgar, G. J., Barrett, N. S., Kininmonth, S. J., & Bates, A. E. (2015). Thermal biases and vulnerability to warming in the world’s marine fauna. Nature, 528, 88. doi:10.1038/nature16144

Taw, N. (1975). Studies on the zooplankton and hydrology of south-eastern coastal waters of Tasmania. University of Tasmania, Hobart.

Figure 1

Mean annual temperatures (°C) from Maria Island (MAI) and Port Hacking (PHB) National Reference Stations in three depth strata (0-10 m, 20-30 m, 40-50 m) in the top 50 m, showing long-term warming since 1946. Data are not shown from Yongala because no long-term data exists from there.

Figure 2

Kernel density plots showing the temperature preferences of the copepods in the analysis for A. Port Hacking between for 15 species, and B. Maria Island for 25 species. C. Yongala for species present across the studies.

Figure 3

The linear model at Port Hacking of the Community Temperature Index (response) and the Period and Seasonal cycle (predictors).

Figure 4

The linear model at Maria Island of the Community Temperature Index (response) and the Period and Seasonal cycle (predictors).

Figure 5

The linear model at Yongala of the Community Temperature Index (response) and the Period (predictor).

Download this Time Series Report

Citing this report: 

Richardson A.J, Davies C, Eriksen R. (2020). The response of the copepod community to long-term warming along the east coast of Australia. In Richardson A.J, Eriksen R, Moltmann T, Hodgson-Johnston I, Wallis J.R. (Eds). State and Trends of Australia’s Ocean Report. doi: 10.26198/5e16ad7949e86

doi: 10.26198/5e16ad7949e86

Access the Data

Access the data that contributes to this time-series by clicking the icons below

02. SOOP-02

Ships of Opportunity

06f. National Reference stations-02

National Reference Stations

Citing the Report

Richardson A.J, Eriksen R, Moltmann T, Hodgson-Johnston I, Wallis J.R. (2020). State and Trends of Australia’s Ocean Report, Integrated Marine Observing System (IMOS).

IMOS_logo-stacked-reversed-01

The State and Trends of Australia's Ocean Report was supported by IMOS. IMOS gratefully acknowledges the additional support provided by the Commonwealth Scientific and Industrial Research Organisation (CSIRO).

The State and Trends of Australia's Ocean website is maintained by IMOS.


NCRIS-PROVIDER-REV

Australia’s Integrated Marine Observing System (IMOS) is enabled by the National Collaborative Research Infrastructure Strategy (NCRIS). It is operated by a consortium of institutions as an unincorporated joint venture, with the University of Tasmania as Lead Agent.

Disclaimer:

You accept all risks and responsibility for losses, damages, costs and other consequences resulting directly or indirectly from using this site and any information or material available from it. While the Integrated Marine Observing System (IMOS) has taken reasonable steps to ensure that the information on this website and related publication is correct, it provides no warranty or guarantee that information provided by the authors is accurate, complete or up-to-date. IMOS does not accept any responsibility or liability for any actions taken as a result of, or in reliance on, information on its website or publication. Users should check with the originating authors to confirm the accuracy of the information before taking any action in reliance on that information.

If you believe any information on this website or in the related publication is inaccurate, out of date or misleading, please bring it to our attention by contacting the authors directly or emailing us at IMOS@imos.org.au


Images and Information:

All information on this website remains the property of those who authored it. All images on this website are licensed through Adobe Stock, Shutterstock, or have permission from the original owner.