Physical and Chemical
1.6
Ocean acidification
Contributors
Bronte Tilbrook1,2
Erik Van Oiijen1
Craig Neill1
Kate Berry1
John Akl1
Abe Passmore1
James Black1
Andrew Lenton1,2
Anthony J. Richardson3,4
1 CSIRO Oceans and Atmosphere, Hobart, TAS, Australia
2 Australian Antarctic Program Partnership, University of Tasmania, Hobart, TAS, Australia
3 CSIRO Oceans and Atmosphere, Queensland Biosciences Precinct (QBP), St Lucia, QLD, Australia
4 Centre for Applications in Natural Resource Mathematics (CARM), School of Mathematics and Physics, The University of Queensland, St Lucia, QLD, Australia
Key Information
The pH and aragonite saturation state of surface seawaters around Australia are influenced by the large-scale circulation, and superimposed on this are the effects of seasonal changes due largely to biological activity and temperature change. Maximum values of aragonite saturation state tend to develop over summer-early autumn, while pH values are typically greatest in winter. Biological production contributes to increases of both pH and aragonite saturation state in the spring-summer, while warming acts to increase the saturation state and decrease pH. Seasonal ranges of both variables are already estimated to be outside the ranges that many of Australia’s marine ecosystems are likely to have experienced in the late 1800s.
Keywords
pH, aragonite saturation,
Ocean acidification
Ocean acidification results from a c hange i n seawater chemistry due to the oceans taking up about 25% of the current anthropogenic emissions of carbon dioxide (CO2) to the atmosphere (Hurd et al. 2018). The CO2 taken up lowers both surface water pH and dissolved carbonate ion concentration and increases dissolved aqueous CO2 and bicarbonate ion concentrations. The changes are rapid, with a decrease in surface water pH of 0.11 estimated to be ten- fold greater than the rate of change at any in the past 300 million years (Honisch et al., 2012). By 2100, the surface ocean pH is expected to decrease by a further 0.1 to 0.4 units and dissolved carbonate ion concentration by up to 50%, leading to similar decreases in the aragonite saturation state (Gattuso et al., 2015). Superimposed on these large-scale changes, is variability at seasonal and local scales associated with natural processes, which can be large enough to amplify or offset ocean acidification trends, particularly in coastal and shelf environments. Ocean acidification can disrupt marine organisms to different degrees with potential flow-on effects for a broad range of ocean services including shellfish aquaculture, coastal protection, and regional economies dependent on healthy and sustainable marine ecosystems (Tilbrook et al., 2019). Data collected from the Integrated Marine Observing System (IMOS) Ships of Opportunity, Moorings and National Reference Station facilities are providing understanding of how ocean chemistry is changing and is providing a baseline to assess the impact on marine organisms.
The pH and aragonite saturation state of seawater have been shown to influence the response of marine life to ocean acidification. These two parameters were determined in the waters around Australia using a climatology of the fugacity of dissolved carbon dioxide (fCO2) combined with total alkalinity values estimated from a salinity-alkalinity relationship for Australian regional seas (Lenton et al., 2016). The carbonate chemistry parameters were averaged for the decade of 2000-2009, and changes since 1870-1889 were calculated assuming changes in fCO2 of surface waters approximate the increase in atmospheric CO2 over the same period (Lenton et al., 2016; Pardo et al., 2019; Takahashi et al., 2009). Water samples collected every 1-4 months at IMOS National Reference Stations were used as a check on the values estimated from the climatology, and to provide information on seasonal variability in coastal waters.
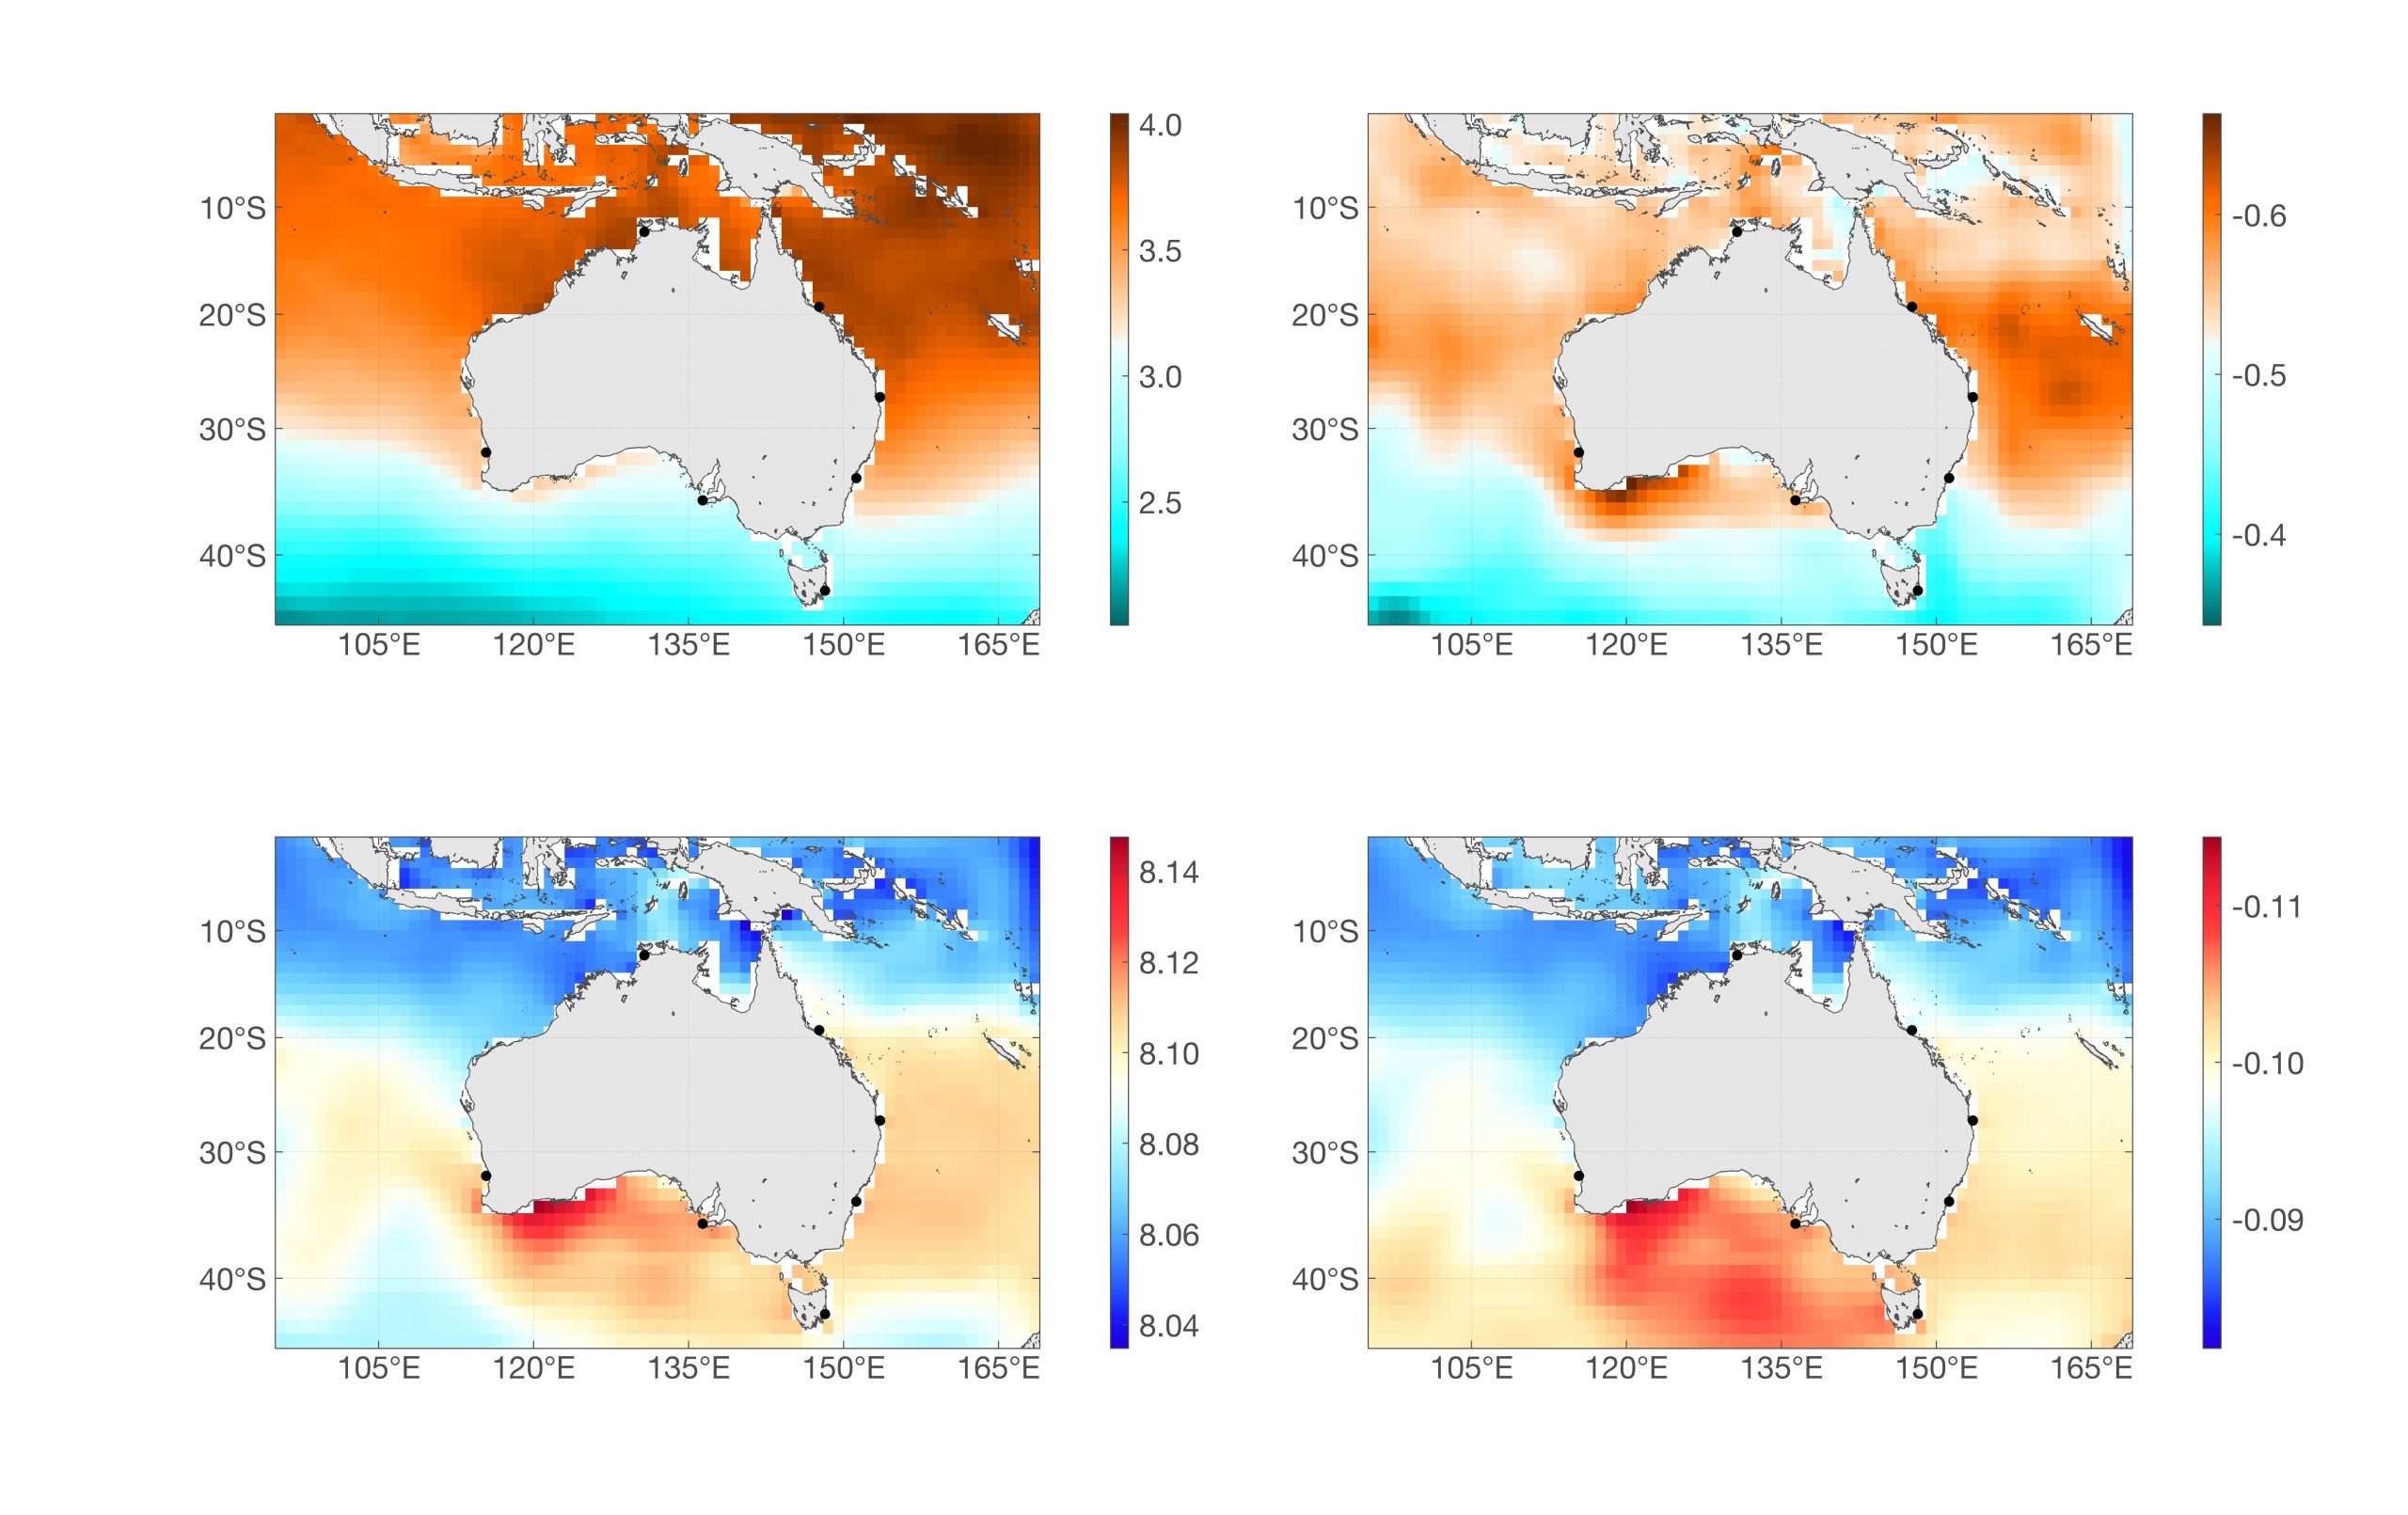
Regional and long-term change: The aragonite saturation state and pH of surface waters have different patterns of change (Figure 1) due to a combination of regional variations in total alkalinity and total dissolved CO2 concentrations, different sensitivities of the saturation state and pH to temperature, and the large-scale transport and mixing of water masses around Australia (Lenton et al., 2016). The aragonite saturation state for 2000-2009 decreases from values approaching 4 in tropical waters to 2.2 near 45°S, while maximum pH values of about 8.10 to 8.12 are found in subtropical waters. Large decreases have occurred since 1870-1890 for both parameters with changes of up to 0.6 in the aragonite saturation state in subtropical waters and the largest changes in pH of about 0.11 have occurred in temperate and sub-Antarctic waters (Figure 1).
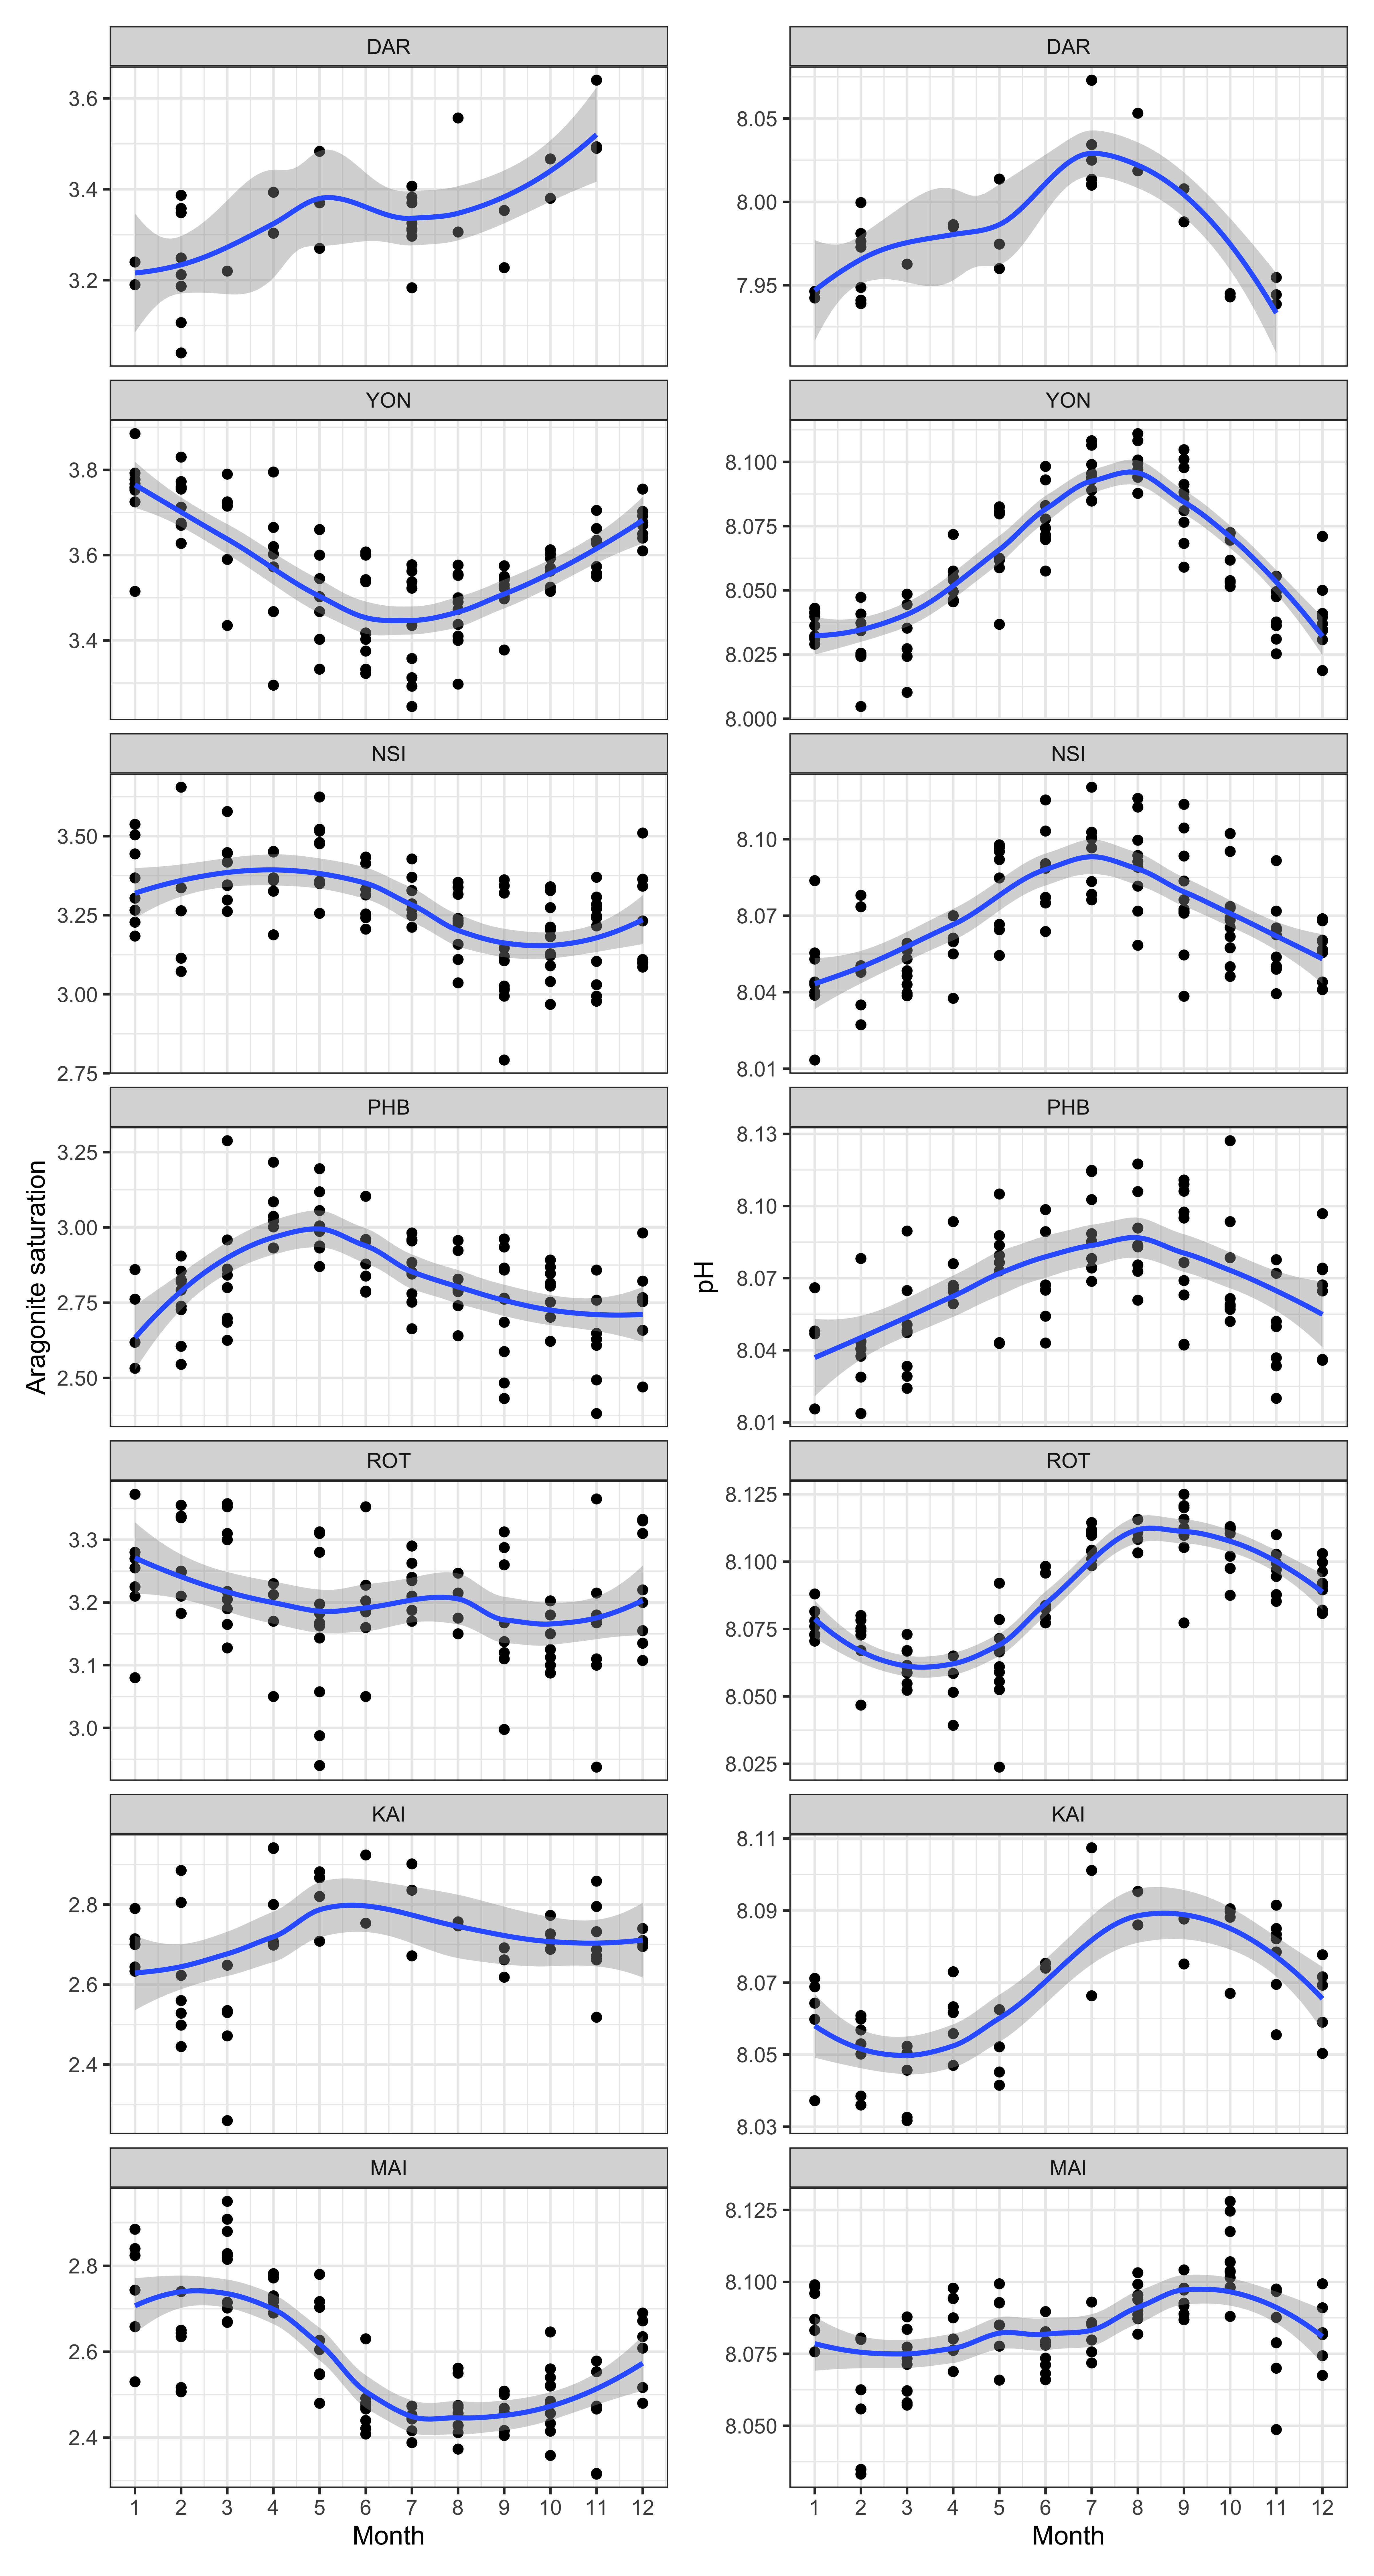
Seasonality: The seasonal cycles of the aragonite saturation state of Australian shelf waters is highlighted by data from the National Reference Stations (Figure 2). The east coast and southern shelf sites show a decrease in the aragonite saturation state from North to South, with maxima in Dec-Apr and minima in Jul-Oct (Figure 2). Seasonal changes in pH are typically out of phase with aragonite saturation state by up to 6 months. Data from the Darwin National Reference Station are shown, but more frequent sampling is needed to better resolve the seasonal and longer time-scale signals at this site.
The seasonality at the sites is influenced by the development of stable and warmer mixed layers in spring-summer, changes in net production, and seasonal changes in the transport of offshore waters that typically have higher aragonite saturation states and lower pH in the spring-summer period compared to winter-autumn. The sensitivity to these processes varies with the site. High-frequency sampling at KAI and MAI using CO2 moorings allow more complete assessments of the cause of the changes by decomposing the drivers of the variability (Pardo et al., 2019 ). At KAI, seasonal warming and cooling tends to dominate the surface fCO2 signal, which covaries with pH, while aragonite saturation state is less sensitive to temperature change and shows only a small range compared to most other locations (Figure 2).
Data from this site also shows occasional low fCO2 (and lower pH) in the summer as upwelling onto the shelf reaches the surface. The seasonality at MAI is also influenced by temperature change, but here the greater transport of warmer and low-CO2 waters in the spring-summer and their retreat in autumn-winter drives a greater change in the aragonite saturation state and these changes partially offset the temperature effect on pH at this site. The high variability at the MAI site is due in part to the passage of warm and cold core eddies through the site. The present-day maximum values at the NRS sites are less than the values for the 1870-1890 period, suggesting that for large parts of the year the biota at these sites are already exposed to conditions outside the range of values that existed in preindustrial times.
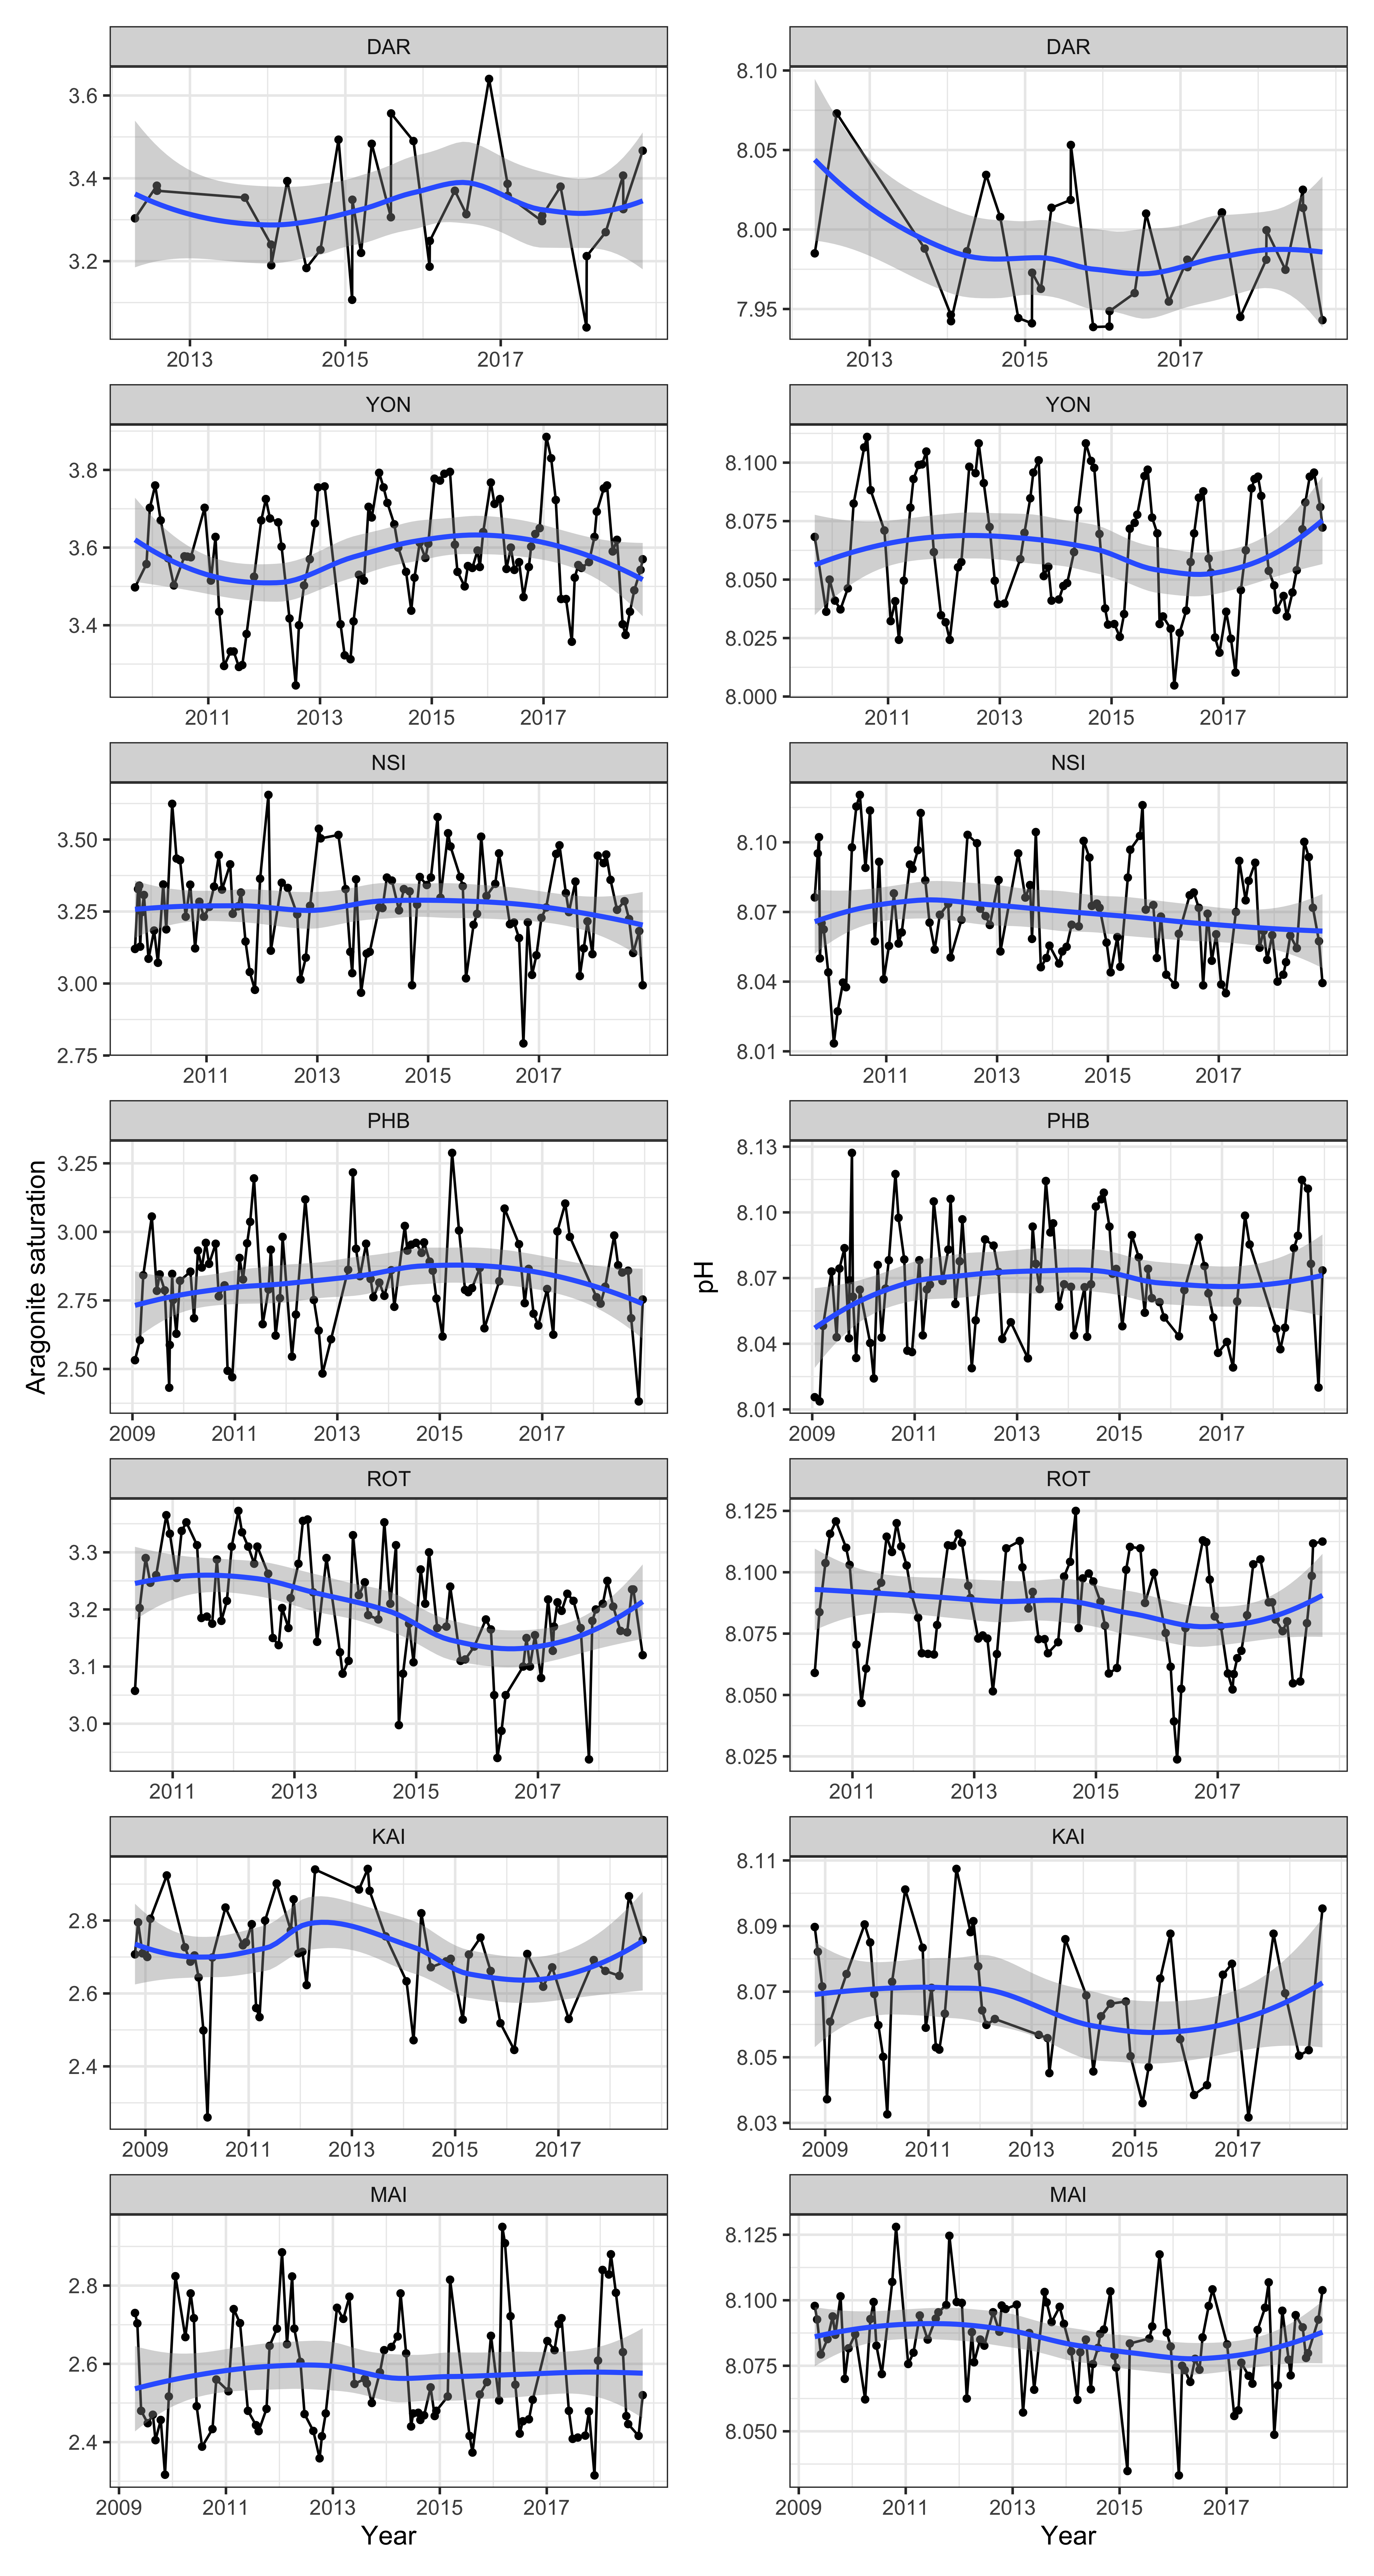
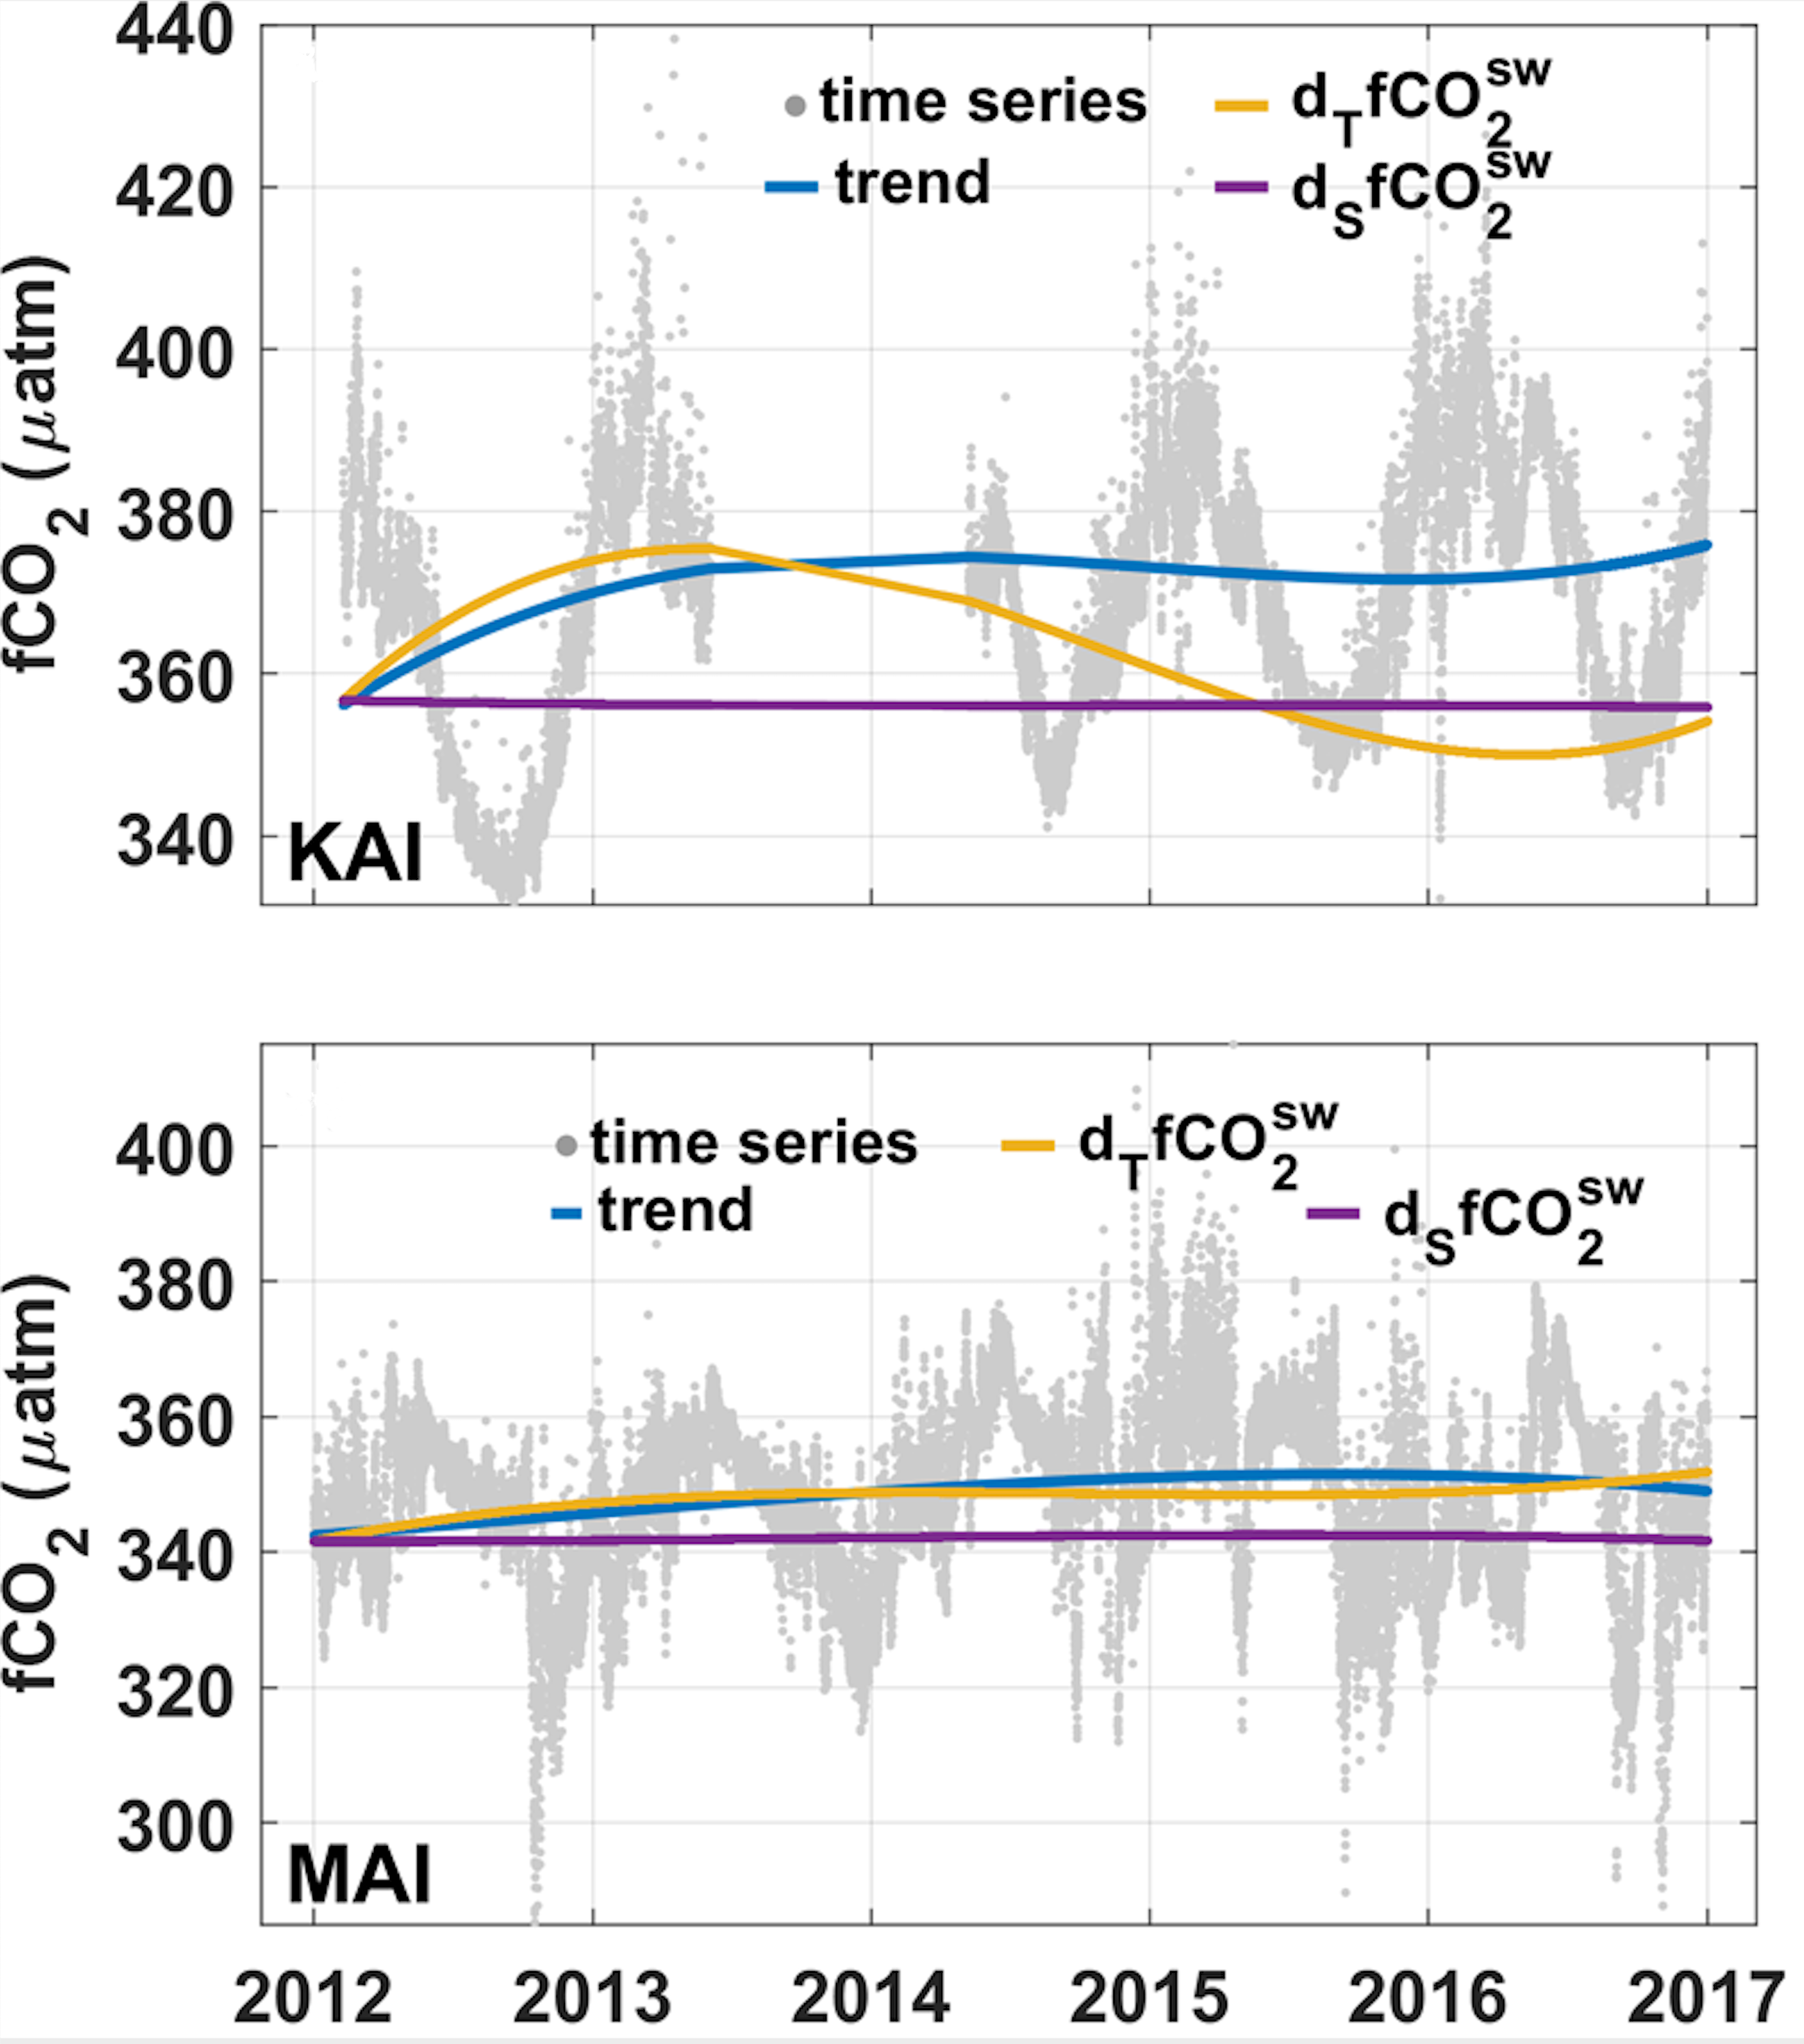
Interannual change: The 10-year sampling at the sites provides an indication of interannual change (Figure 3). De-seasonalised high-frequency mooring data for KAI and MAI (Figure 4) do show that changes in circulation and the transport of water mass es is driving much of the interannual variability in surface water CO2 at these two sites. At KAI, the relative strengths of the Leeuwin and Flinders current appear to influence the variability while the interannual changes at MAI are consistent with a greater component of subtropical waters being transported by the East Australian Current into the region over time.
As one of the main marine stressors, ocean acidification is expected to impact a wide range of marine organisms in the future, including coral reefs and wild and farmed shellfisheries that generate substantial income and support local communities. The range of seawater pH and aragonite saturation state values that occur for large parts of the year are already outside the range of values that were likely in the late 1800s. These data will provide a foundation to assess the response of benthic and pelagic biota to the changes, and for understanding how ocean carbon cycling is evolving in Australia's seas, including in the major boundary current regions.
Gattuso, J. P., Magnan, A., Bille, R., Cheung, W. W. L., Howes, E. L., Joos, F., . . . Turley, C. (2015). Contrasting futures for ocean and society from different anthropogenic CO2 emissions scenarios. Science, 349(6243), 11. doi:10.1126/science.aac4722
Honisch, B., Ridgwell, A., Schmidt, D. N., Thomas, E., Gibbs, S. J., Sluijs, A., . . . Williams, B. (2012). The geological record of ocean acidification. Science, 335(6072), 1058-1063. doi:10.1126/science.1208277
Hurd, C. L., Lenton, A., Tilbrook, B., & Boyd, P. W. (2018). Current understanding and challenges for oceans in a higher-CO2 world. Nature Climate Change, 8(8), 686-694. doi:10.1038/s41558-018-0211-0
Lenton, A., Tilbrook, B., Matear, R. J., Sasse, T. P., & Nojiri, Y. (2016). Historical reconstruction of ocean acidification in the Australian region. Biogeosciences, 13(6), 1753-1765. doi:10.5194/bg-13-1753-2016
Pardo, P. C., Tilbrook, B., van Ooijen, E., Passmore, A., Neill, C., Jansen, P., . . . Trull, T. W. (2019). Surface ocean carbon dioxide variability in South Pacific boundary currents and Subantarctic waters. Scientific Reports, 9, 12. doi:10.1038/s41598-019-44109-2
Takahashi, T., Sutherland, S. C., Wanninkhof, R., Sweeney, C., Feely, R. A., Chipman, D. W., . . . de Baar, H. J. W. (2009). Climatological mean and decadal change in surface ocean pCO(2), and net sea-air CO2 flux over the global oceans. Deep-Sea Research Part Ii-Topical Studies in Oceanography, 56(8-10), 554-577. doi:10.1016/j.dsr2.2008.12.009
Tilbrook, B., Jewett, E. B., DeGrandpre, M. D., Hernandez-Ayon, J. M., Feely, R. A., Gledhill, D. K., . . . Telszewski, M. (2019). An enhanced ocean acidification observing network: from people to technology to data synthesis and information exchange. Frontiers in Marine Science, 6, 21. doi:10.3389/fmars.2019.00337
Figure 1
Top left: Mean aragonite saturation state of surface water for the decade 2000-2009; Top right: Estimated change in mean aragonite saturation state of surface waters between 1870-1890 and 2000-2009. Black circles show the location of IMOS National Reference Stations; Bottom left: Mean pH (total scale) of surface water for 2000-2009; Bottom right: Estimated change in average pH of surface waters between 1870-1890 and 2000-2009.
Figure 2
Monthly climatology of aragonite saturation (left) and pH (right) at National Reference Stations Darwin (DAR), Yongala (YON), North Stradbroke Island (NSI), PHB (Port Hacking), ROT (Rottnest Island), KAI (Kangaroo Island) and MAI (Maria Island).
Figure 3
Inter-annual time series of aragonite saturation (left) and pH (right) at National Reference Stations Darwin (DAR), Yongala (YON), North Stradbroke Island (NSI), PHB (Port Hacking), ROT (Rottnest Island), KAI (Kangaroo Island) and MAI (Maria Island).
Figure 4
Interannual variability in the carbon system at MAI and KAI. Original data between 2012 and 2016 (grey dots) and de-seasonalised interannual trend (blue line) of surface water fCO2 with the contributions of temperature (dTfCO2SW, orange line), salinity (dSfCO2SW, magenta line). Figure adapted from (Pardo et al., 2019) .
Download this Time Series Report
Citing this report:
Tilbrook B, Van Oiijen E, Neill C, Berry K, Akl J, Passmore A, Black J, Lenton A, Richardson A.J. (2020) Ocean acidification. In Richardson A.J, Eriksen R, Moltmann T, Hodgson-Johnston I, Wallis J.R. (Eds). State and Trends of Australia’s Ocean Report. doi: 10.26198/5e16a38849e78
doi: 10.26198/5e16a38849e78
Citing the Report
Richardson A.J, Eriksen R, Moltmann T, Hodgson-Johnston I, Wallis J.R. (2020). State and Trends of Australia’s Ocean Report, Integrated Marine Observing System (IMOS).

The State and Trends of Australia's Ocean Report was supported by IMOS. IMOS gratefully acknowledges the additional support provided by the Commonwealth Scientific and Industrial Research Organisation (CSIRO).
The State and Trends of Australia's Ocean website is maintained by IMOS.

Australia’s Integrated Marine Observing System (IMOS) is enabled by the National Collaborative Research Infrastructure Strategy (NCRIS). It is operated by a consortium of institutions as an unincorporated joint venture, with the University of Tasmania as Lead Agent.
Disclaimer:
You accept all risks and responsibility for losses, damages, costs and other consequences resulting directly or indirectly from using this site and any information or material available from it. While the Integrated Marine Observing System (IMOS) has taken reasonable steps to ensure that the information on this website and related publication is correct, it provides no warranty or guarantee that information provided by the authors is accurate, complete or up-to-date. IMOS does not accept any responsibility or liability for any actions taken as a result of, or in reliance on, information on its website or publication. Users should check with the originating authors to confirm the accuracy of the information before taking any action in reliance on that information.
If you believe any information on this website or in the related publication is inaccurate, out of date or misleading, please bring it to our attention by contacting the authors directly or emailing us at IMOS@imos.org.au
Images and Information:
All information on this website remains the property of those who authored it. All images on this website are licensed through Adobe Stock, Shutterstock, or have permission from the original owner.
