Biological Time Series - Productivity

2.3

Contrasting Trends of Australia’s Plankton Communities

Contributors

Jason D. Everett1,2,4

Anthony J. Richardson1,2

Claire Davies3

Ruth Eriksen3

1 CSIRO Oceans and Atmosphere, Queensland Biosciences Precinct (QBP), St Lucia, QLD, Australia
2 Centre for Applications in Natural Resource Mathematics (CARM), School of Mathematics and Physics, The University of Queensland, St Lucia, QLD, Australia
3 CSIRO Oceans and Atmosphere, Hobart, TAS, Australia
4 School of Biological, Earth and Environmental Sciences, University of New South Wales, Sydney, NSW, Australia

Key Information

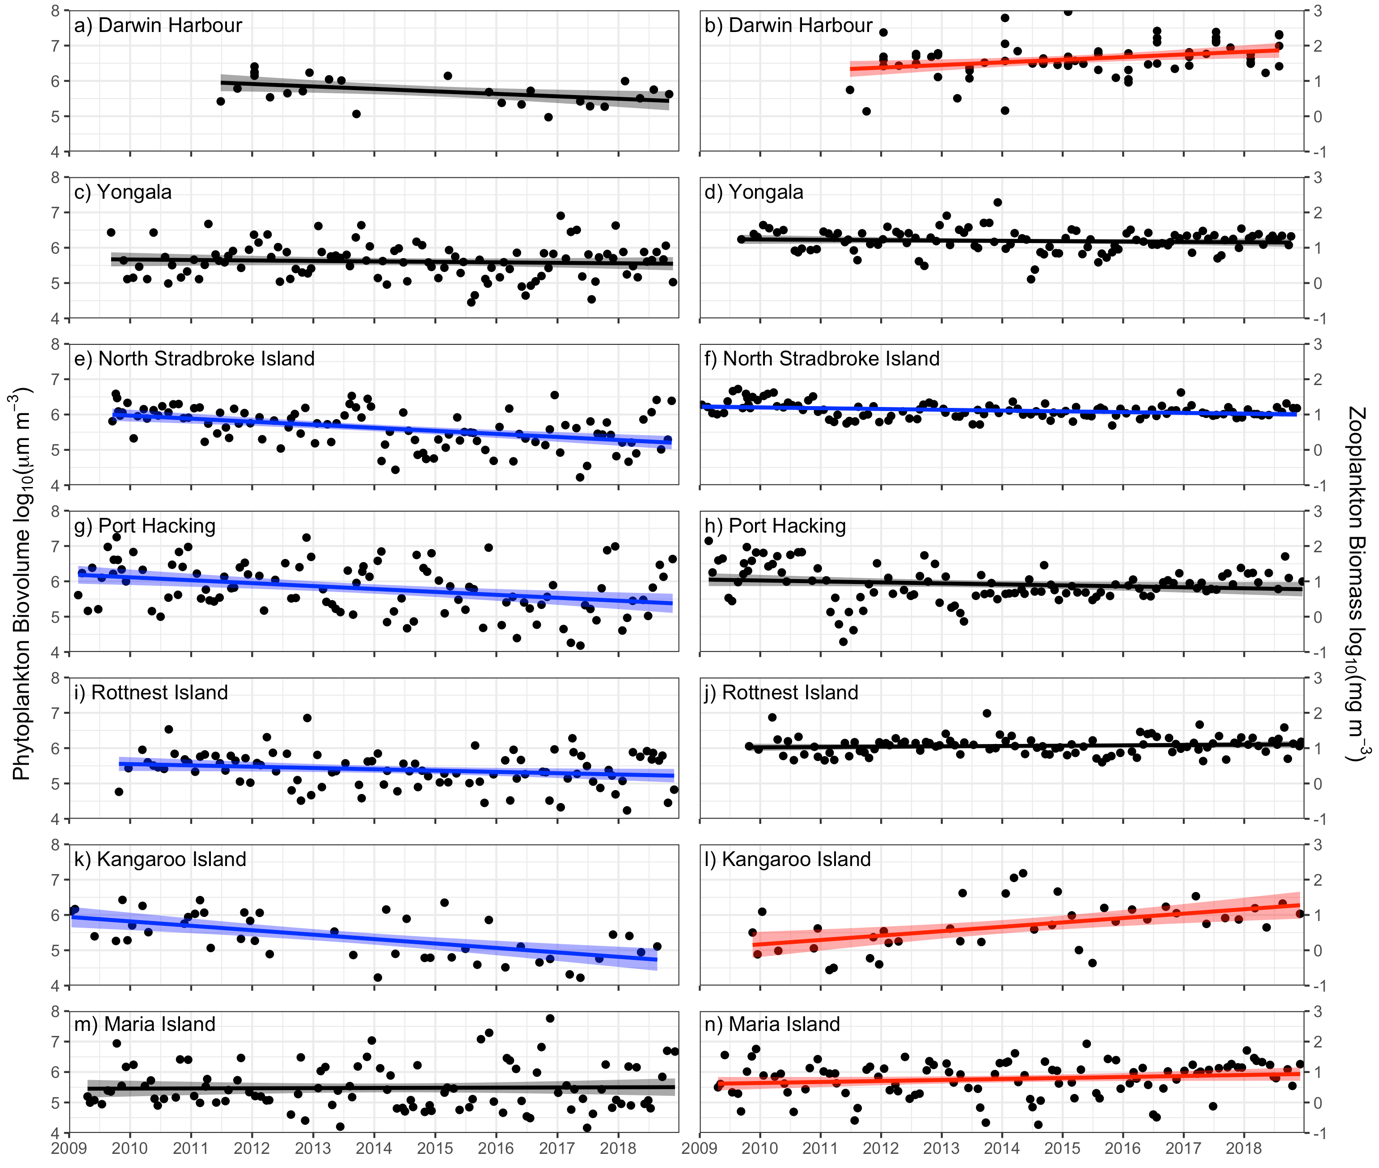
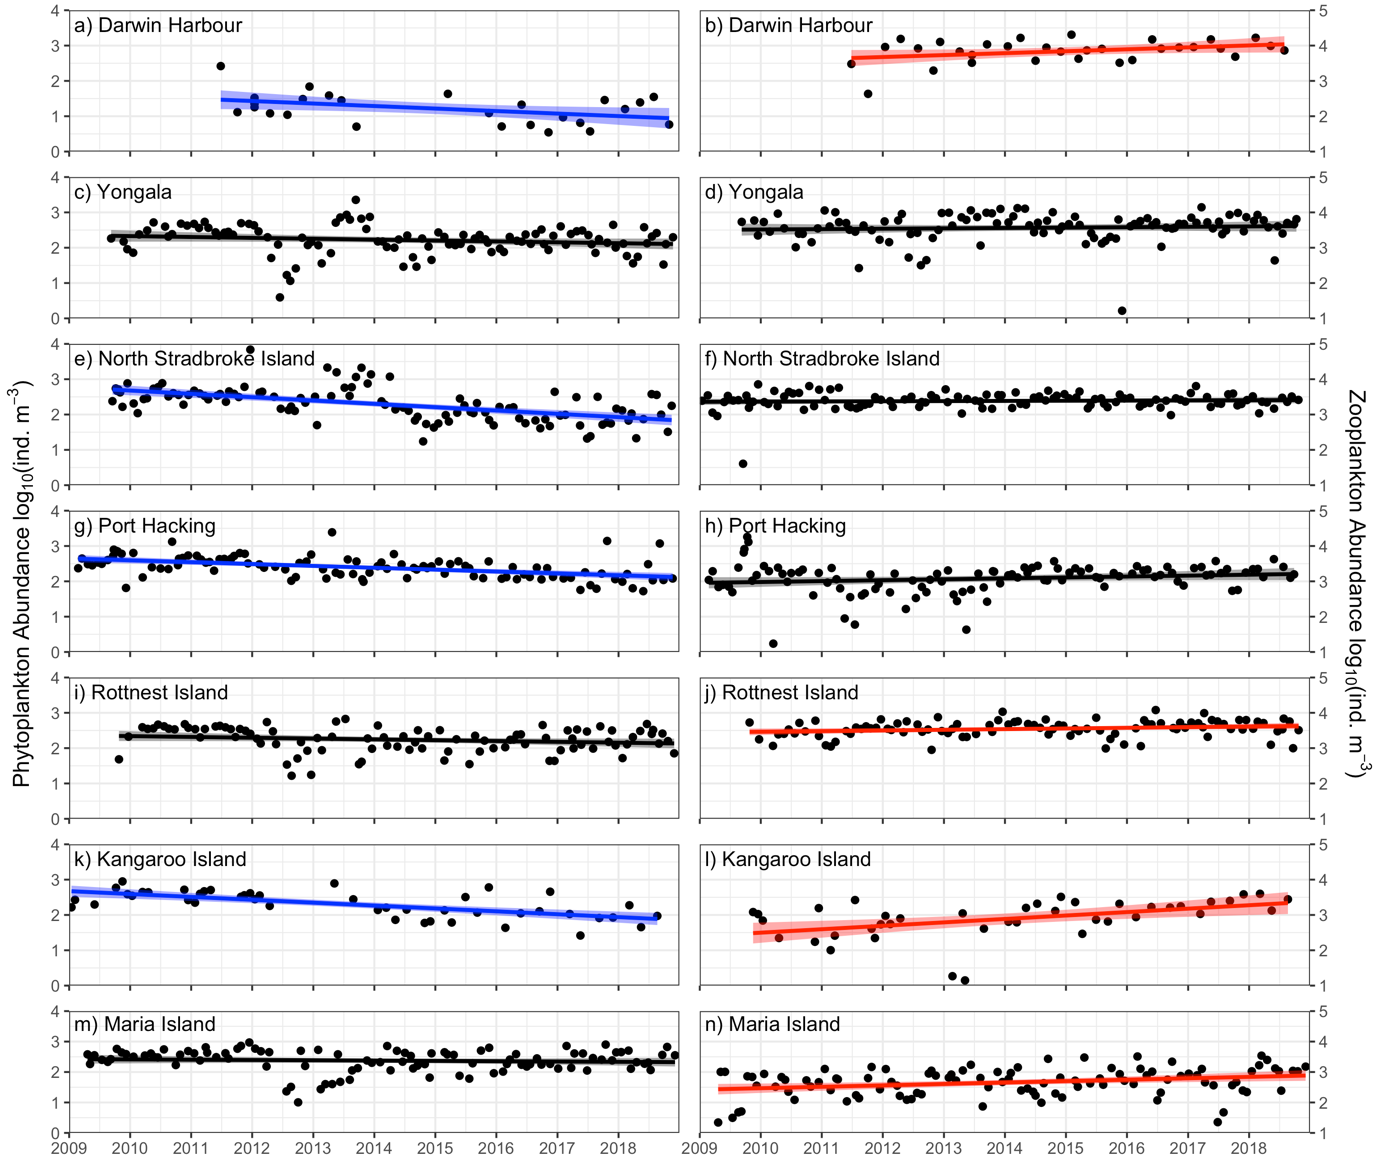
We show that around Australia, phytoplankton are, on average, decreasing in their abundance, a trend consistent with other observations including both chlorophyll a and primary production. Despite this trend in phytoplankton, zooplankton have generally been increasing in their abundance and biomass, with implications for the fish communities they can potentially support.

Keywords

phytoplankton, zooplankton, biomass, long-term change

Contrasting Trends of Australia’s Plankton Communities

The magnitude and distribution of fish caught in the ocean depends on the biomass of phytoplankton (microscopic photosynthetic “plants”) and zooplankton (animal drifters) at the base of the food web (Chassot et al., 2010; Irigoien et al., 2014). Changes in phytoplankton biomass will constrain future fish biomass (Lam, Cheung, Reygondeau, & Sumaila, 2016). Under climate change, global models show an overall decline in global phytoplankton biomass (C. A. Stock, Dunne, & John, 2014; Woodworth-Jefcoats, Polovina, & Drazen, 2017), but with increases in some regions and declines in others. However, the idea that reduced phytoplankton biomass directly translates to reduced fish biomass ignores the complex phytoplankton-zooplankton role. As the intermediate trophic link in the ocean, zooplankton graze on phytoplankton, heterotrophic microbes, and each other, and are eaten by fish, seabirds and marine mammals. They are thus pivotal in the transfer of energy to higher trophic levels.

Here we present 10 years (2009-2019) of phytoplankton and zooplankton abundance and biomass data from the seven Integrated Marine Observing System (IMOS) National Reference Stations (NRS) to investigate long-term changes in the two lowest trophic levels in the ocean. We use multiple lines of evidence to investigate changes in phytoplankton. We use two measures to represent change in the phytoplankton: viz. changes in biovolume of phytoplankton and changes in abundance. These measures are based on phytoplankton samples collected by Niskin bottles at several depths, mixed into a single sample, and counted in the laboratory (Eriksen et al., 2019). We also use two measures to represent change in the zooplankton: viz. changes in biomass and changes in the abundance. These measures are based on zooplankton samples collected with a 100 mm mesh drop net and counted (for abundance) or dried and weighed (biomass) in the laboratory.

Data were analysed using a linear model with the response variable being either Abundance or Biomass/Biovolume, and predictors being Date (continuous) and Month (a fixed factor). Including Month in the model adjusts for the temporal autocorrelation. Based on visual inspection of the diagnostic plots, a log10 transformation of the response improved the normality and homogeneity of variance assumptions.

All data were sourced from the IMOS Australian Ocean Data Network (AODN) (https://portal.aodn.org.au/; see the datasets IMOS National Reference Station (NRS) - Phytoplankton Abundance and Biovolume”, “IMOS National Reference Station (NRS) - Zooplankton Abundance”, “IMOS National Reference and “IMOS National Reference Station (NRS) - Zooplankton Biomass”)

Both phytoplankton biovolume (Figure 1, column 1) and abundance (Figure 2, column 1) are declining significantly at North Stradbroke Island, Port Hacking and Kangaroo Island NRS. Phytoplankton biovolume is also declining at Rottnest Island, and abundance is declining at Darwin. Kangaroo Island had the largest relative decline in biovolume (-96% decade-1, -579,271 mm3 m-3 decade-1) and a 76% decade-1 decline in abundance (-267 cells m-3 decade-1). North Stradbroke Island had a 93% decade-1 decline in abundance (-389 cells m-3 decade-1) and Port Hacking had a significant decline in both abundance (54% decade-1, -209 cells m-3 decade-1) and biovolume (-80% decade-1, -717,364 mm3 m-3 decade-1)

By contrast, zooplankton abundance (Figure 1, column 2) and biomass (Figure 2, column 2) are increasing at Darwin (174 mg m-3 decade-1; 9372 individuals m-3 decade-1), Kangaroo Island (25 mg m-3 decade-1; 2630 individuals m-3 decade-1) and Maria Island (19 mg m-3 decade-1; 359 individuals m-3 decade-1). Zooplankton abundance, but not biomass, is increasing at Rottnest Island (1277 individuals m-3 decade-1). The biomass of zooplankton is declining at North Stradbroke Island (-5 mg m-3 decade-1), making it the only station that shows a consistent pattern (decline or increase) between phytoplankton and zooplankton, and the only station that has a declining zooplankton biomass (albeit only a small decline).

Around Australia, we found that phytoplankton are generally decreasing in abundance. This is consistent with observed declines in chlorophyll-a (see State and Trends of Australia’s Ocean Report 2.1: Spatial and seasonal trends in Chlorophyll a and primary production). 

Somewhat surprisingly, therefore, we found that zooplankton are not decreasing in response to the phytoplankton decline, but are generally increasing. Over large time and space scales, zooplankton abundance and biomass typically follow changes in phytoplankton, their primary food source (Richardson & Schoeman, 2004). Recent work has shown that differences in fish catch across the ocean far exceed differences in phytoplankton production, indicating that zooplankton is playing a major role (Stock et al., 2017). The increase in zooplankton despite the decline in phytoplankton could be because of increases in microzooplankton (not measured in this analysis), which are grazed upon by larger omnivorous zooplankton. An alternative theory is that there is a relaxation of top-down control of zooplankton. For instance, fewer planktivorous fish (small fish species that eat zooplankton such as mado, yakka and anchovy) could reduce the predation pressure on zooplankton and lead to them increasing in abundance. Despite being more common on coastal reefs (Bellwood et al., 2018), we know little about planktivorous fish in most coastal regions of Australia.

An outstanding question is whether these substantial changes in lower trophic levels are impacting coastal fish communities. Typically, higher zooplankton biomass supports higher fish biomass (Chassot et al., 2010; Ware & Thomson, 2005). Whether these trends in phytoplankton and zooplankton continue is an outstanding question, and one that IMOS is well placed to answer in the future.

Bellwood, D. R., Streit, R. P., Brandl, S. J., & Tebbett, S. B. (2018). The meaning of the term ‘function’ in ecology: A coral reef perspective. Functional Ecology, 0(0). doi:10.1111/1365-2435.13265

Chassot, E., Bonhommeau, S., Dulvy, N. K., Mélin, F., Watson, R., Gascuel, D., & Le Pape, O. (2010). Global marine primary production constrains fisheries catches. Ecology Letters, 13(4), 495-505. doi:10.1111/j.1461-0248.2010.01443.x

Eriksen, R. S., Davies, C. H., Bonham, P., Coman, F. E., Edgar, S., McEnnulty, F., . . . Richardson, A. J. (2019). Australia’s long-term plankton observations: the Integrated Marine Observing System National Reference Station network. Frontiers in Marine Science.

FAO. (2016). The State of World Fisheries and Aquaculture 2016. Contributing to food security and nutrition for all. Retrieved from Rome:

Irigoien, X., Klevjer, T. A., Røstad, A., Martinez, U., Boyra, G., Acuña, J. L., . . . Kaartvedt, S. (2014). Large mesopelagic fishes biomass and trophic efficiency in the open ocean. Nature Communications, 5, 3271. doi:10.1038/ncomms4271 https://www.nature.com/articles/ncomms4271#supplementary-information

Lam, V. W. Y., Cheung, W. W. L., Reygondeau, G., & Sumaila, U. R. (2016). Projected change in global fisheries revenues under climate change. Scientific Reports, 6, 32607. doi:10.1038/srep32607 https://www.nature.com/articles/srep32607#supplementary-information

Richardson, A. J., & Schoeman, D. S. (2004). Climate impact on plankton ecosystems in the northeast Atlantic. Science, 305(5690), 1609-1612. doi:10.1126/science.1100958

Stock, C. A., Dunne, J. P., & John, J. G. (2014). Drivers of trophic amplification of ocean productivity trends in a changing climate. Biogeosciences, 11(24), 7125-7135. doi:10.5194/bg-11-7125-2014

Stock, C. A., John, J. G., Rykaczewski, R. R., Asch, R. G., Cheung, W. W. L., Dunne, J. P., . . . Watson, R. A. (2017). Reconciling fisheries catch and ocean productivity. Proceedings of the National Academy of Sciences, 114(8), E1441-E1449. doi:10.1073/pnas.1610238114

Ware, D. M., & Thomson, R. E. (2005). Bottom-Up Ecosystem Trophic Dynamics Determine Fish Production in the Northeast Pacific. Science, 308(5726), 1280. doi:10.1126/science.1109049

Woodworth-Jefcoats, P. A., Polovina, J. J., & Drazen, J. C. (2017). Climate change is projected to reduce carrying capacity and redistribute species richness in North Pacific pelagic marine ecosystems. Global Change Biology, 23(3), 1000-1008. doi:10.1111/gcb.13471

Figure 1

Phytoplankton biovolume (log10 mm3 m-3; left column) and Zooplankton Biomass (log10 mg m-3; right column). Data are plotted with blue (decreasing) and red (increasing) trendlines indicating a significant change. Black trendlines indicate no statistically significant change.

Figure 2

Phytoplankton (left column) and zooplankton (right column) abundance (log10 counts m-3) at each NRS. Data are plotted with blue (decreasing) and red (increasing) trendlines indicating a significant change. Black trendlines indicate no statistically significant change.

Download this Time Series Report

Citing this report: 

Everett J.D, Richardson A.J, Davies C, Eriksen R. (2020) Contrasting trends of Australia’s plankton communities. In Richardson A.J, Eriksen R, Moltmann T, Hodgson-Johnston I, Wallis J.R. (Eds). State and Trends of Australia’s Ocean Report. doi: 10.26198/5e16a4e849e7b

doi: 10.26198/5e16a4e849e7b

Access the Data

Access the data that contributes to this time-series by clicking the icons below

06f. National Reference stations-02

National Reference Stations

Citing the Report

Richardson A.J, Eriksen R, Moltmann T, Hodgson-Johnston I, Wallis J.R. (2020). State and Trends of Australia’s Ocean Report, Integrated Marine Observing System (IMOS).

IMOS_logo-stacked-reversed-01

The State and Trends of Australia's Ocean Report was supported by IMOS. IMOS gratefully acknowledges the additional support provided by the Commonwealth Scientific and Industrial Research Organisation (CSIRO).

The State and Trends of Australia's Ocean website is maintained by IMOS.


NCRIS-PROVIDER-REV

Australia’s Integrated Marine Observing System (IMOS) is enabled by the National Collaborative Research Infrastructure Strategy (NCRIS). It is operated by a consortium of institutions as an unincorporated joint venture, with the University of Tasmania as Lead Agent.

Disclaimer:

You accept all risks and responsibility for losses, damages, costs and other consequences resulting directly or indirectly from using this site and any information or material available from it. While the Integrated Marine Observing System (IMOS) has taken reasonable steps to ensure that the information on this website and related publication is correct, it provides no warranty or guarantee that information provided by the authors is accurate, complete or up-to-date. IMOS does not accept any responsibility or liability for any actions taken as a result of, or in reliance on, information on its website or publication. Users should check with the originating authors to confirm the accuracy of the information before taking any action in reliance on that information.

If you believe any information on this website or in the related publication is inaccurate, out of date or misleading, please bring it to our attention by contacting the authors directly or emailing us at IMOS@imos.org.au


Images and Information:

All information on this website remains the property of those who authored it. All images on this website are licensed through Adobe Stock, Shutterstock, or have permission from the original owner.