Biological Time Series - Marine Animals

4.8

Tracking elephant seal population trends in the Southern Ocean

Contributors

Clive McMahon1

Rob Harcourt2

Mark Hindell1

1 Institute for Marine and Antarctic Studies, University of Tasmania, Hobart, TAS, Australia
2 Marine Predator Research Group, Department of Biological Sciences, Faculty of Science and Engineering, Macquarie University, North Ryde, NSW, Australia

Key Information

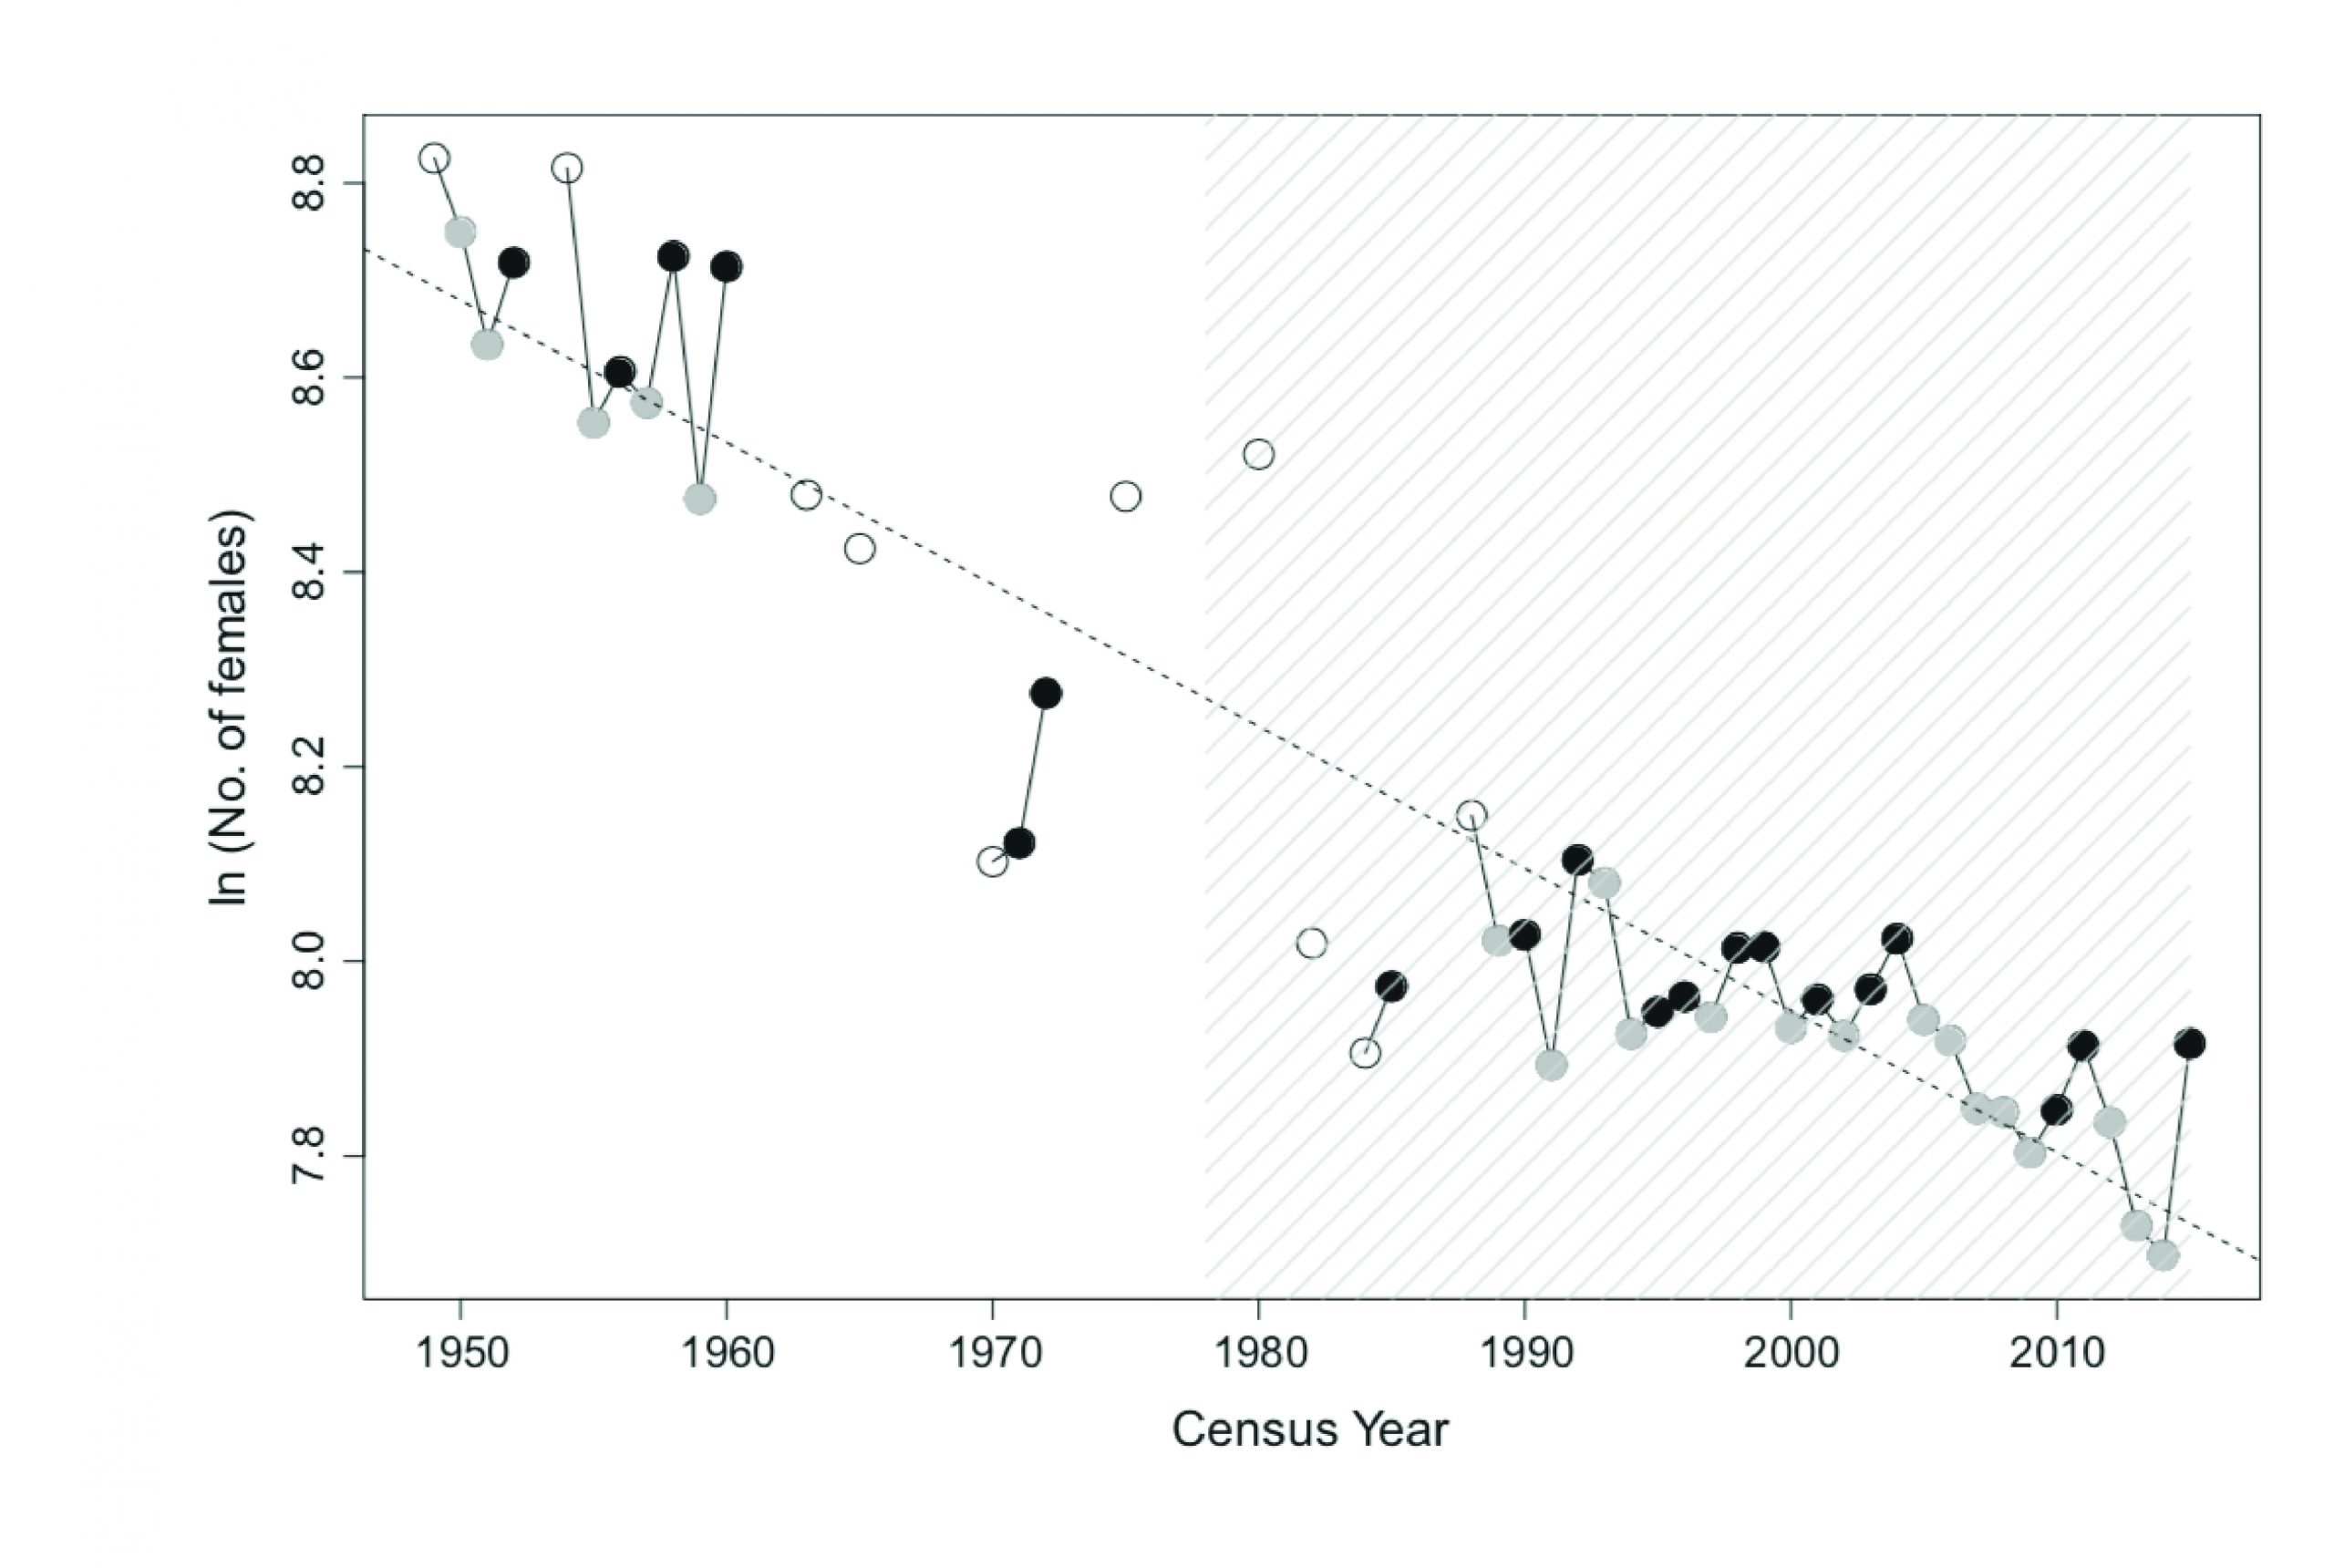
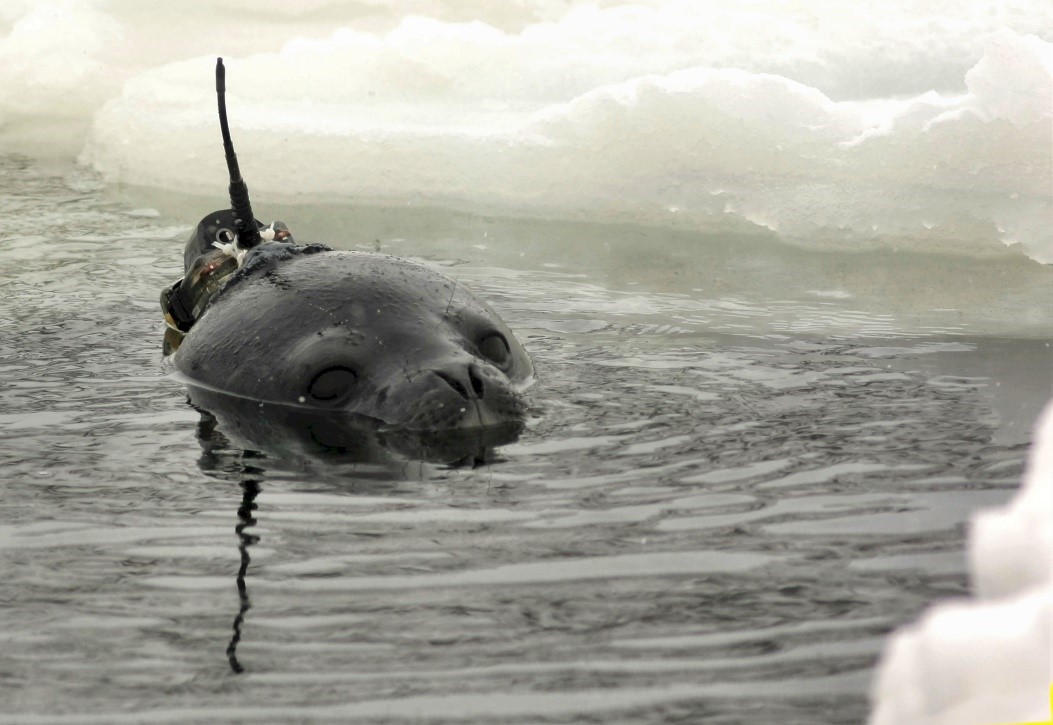
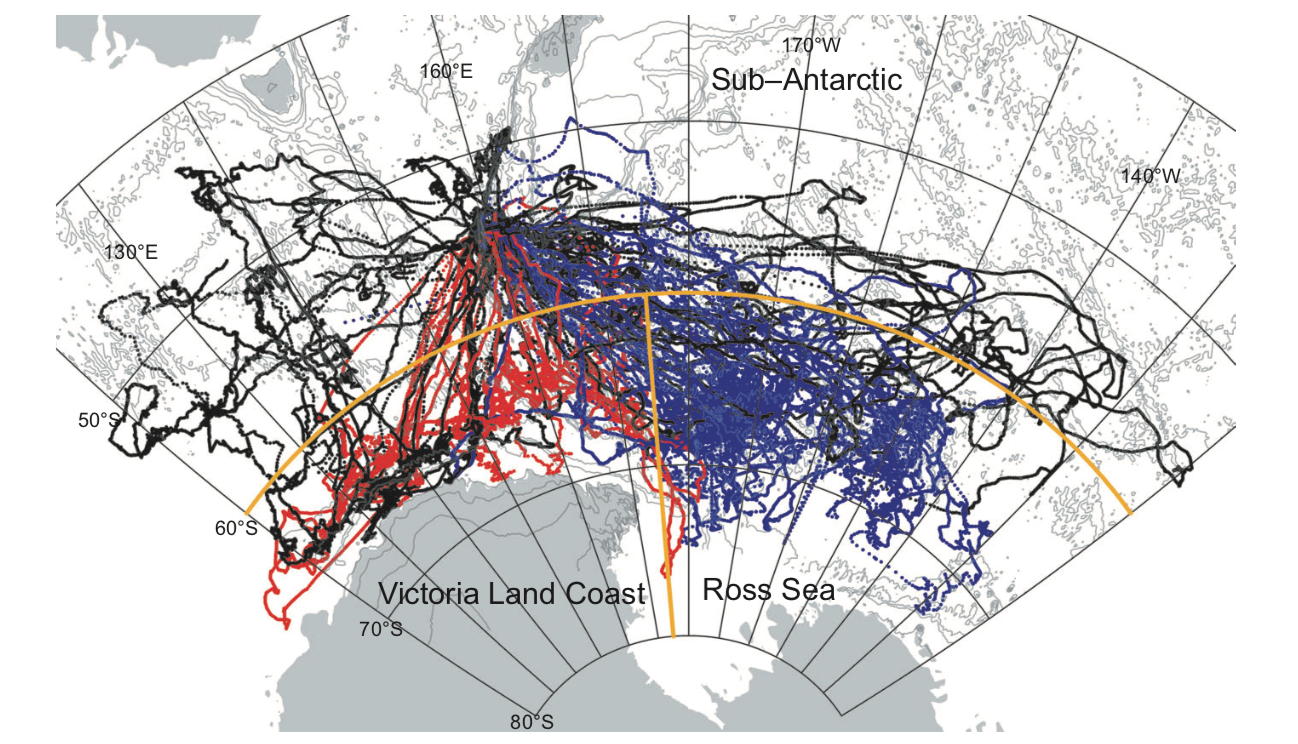
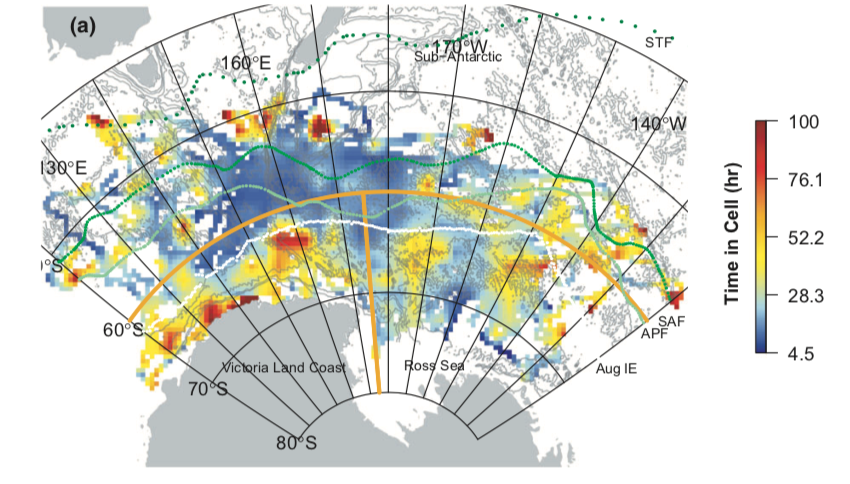
Using satellite tagged southern elephant seals equipped with in situ data loggers we show that the decrease in the Macquarie Island population is related to increasing sea ice concentrations in forging grounds along the Victoria Land Coast. Seals that feed in the relatively stable sub-Antarctic however (representing approximately 40% of the Macquarie Island population) are experiencing population growth. A predicted continued increase in sea ice in Antarctic foraging regions indicates that southern elephant seal populations will continue to decrease in the southern Pacific Ocean.

Keywords

Macquarie Island, sea ice, sub-Antarctic, Ross Sea, Victoria Land

Tracking elephant seal population trends in the Southern Ocean

For over sixty years, the southern elephant seal population at Macquarie Island has been decreasing at an average rate of 1.2% per year (Figure 1). Macquarie Island has the sole breeding population in the southern Pacific Ocean and is one of the four distinct stocks of southern elephant seals found around the southern hemisphere. These four stocks are genetically distinct, with limited mixing among populations. Currently, only the Macquarie Island population is decreasing and the explanation for this is that food availability is regulating population growth, although the proximate mechanism of how food availability affects population growth remains unclear. The most likely explanation is that population growth in southern elephant seals is determined by a combined response of individuals using a patchwork of habitats resulting in variable foraging and ultimately breeding success, the sum total of which is an overall slow, decline in the population. A major challenge for testing this hypothesis is to quantify links between individual maternal foraging zones and pup weaning mass (i.e., food quality in those zones) and the contribution to population growth for a large sample of animals.

Surface waters off the east coast of Australia have warmed by up to 2°C over the past 70 years, with greater warming in the south (e.g., Maria Island) than further north (e.g., Port Hacking) (Figure 1). This is a consequence of global warming and its influence on the intensification of the poleward-flowing East Australian Current (EAC) (Cai, Shi, Cowan, Bi, & Ribbe, 2005), which is distributing more warm-water to southern Australia (Ridgway, 2007). This increasing  strength of the EAC has contributed to ocean warming off southeast Australia ~3–4 times the global average (Ridgway, 2007).

Here we compare the IMOS copepod data from three National Reference Stations in eastern Australia – Maria Island (42.6°S), Port Hacking (34.1°S) and Yongala (19.3°S). We chose these regions because there was historical data in each region to assess whether there is a signature of warming in the copepod community.

Much of what we now know about elephant seal migration and foraging behaviour comes from biotelemetry. Satellite trackers or data-loggers can be attached to individual animals to follow their movements during the long post-breeding and post-moult periods at sea (80 and 280 days respectively) and to record foraging depths and prey encounter rates. Such studies can be logistically difficult or expensive and often samples are restricted to few individuals. The challenge is knowing how representative these samples (typically <500 individuals) are of the population being studied.

The Integrated Marine Observing System (IMOS) has been instrumental in resolving the vexing question of where seals forage and how this may be linked to long-term population growth. Female southern elephant seals were tagged at Macquarie island to investigate where seals fed and to assess the quality of these feeding areas (Figure 2). We used in situ environmental data collected by seals (Conductivity, Temperature and Depth) to describe the water masses where seals were feeding and linked this to broader indices of environmental state including sea-ice extent (Hindell et al., 2017; McMahon, Harcourt, Burton, Daniel, & Hindell, 2017).

The study lead by Mark Hindell (2017) at the Institute for Marine and Antarctic Studies (IMAS) found that there were three main groups of seals specialised in feeding in different ocean realms, viz. the sub-Antarctic, the Ross Sea and the Victoria Land Coast (Figure 3). Physical and climate attributes (e.g., wind strength, sea surface height, ocean current strength) varied amongst the realms and also displayed different temporal trends over the last four decades. Most notably, sea ice extent increased in the Victoria Land realm, while it decreased overall in the Ross Sea realm. Indeed, this increase in sea-ice along the Victoria Land Coast is one of the few regions in the Antarctic where sea-ice is increasing. Using a species distribution model, mean residence times (i.e., the time the seals spent in each 50 by 50 km grid cell) was related to nine climate and physical co-variates. By predicting the seal residence times spatially, the core feeding regions used by the seals could be identified across the Southern Ocean from 120°E to 120°W (Figure 4).

Interestingly, the seal population size at Macquarie Island was negatively correlated with ice concentration within the core habitat of seals using the Victoria Land Coast, where the sea-ice is increasing, and predicted to continue to increase over the next decades. Consequences of these changes on the Antarctic biota are unknown. But what is known is that for elephant seals there is a negative relationship between seal numbers at Macquarie Island and increased sea-ice, implying that the population in the southern Pacific Ocean will continue to decrease. However, despite this negative relationship between sea-ice and population numbers, 40% of the Macquarie Island females fed in the relatively stable sub-Antarctic region. In this region there is a positive relationship with population growth; this positive relationship may buffer the Macquarie population against longer-term regional changes in habitat quality.

In the Anthropocene, wild animals now make up <4% of the world’s animal biomass. Identifying how these remaining animals might respond to on-going human activities needs strong, evidence-based science and innovative approaches. This study has shown that by combining new approaches to tracking animals that enable us to quantify their behaviours while simultaneously measuring the physical attributes of their remote feeding areas, we can put our finger on the underlying drivers of population change of even these most enigmatic of animals inhabiting the world’s remote Southern Ocean.

Hindell, M. A., Sumner, M., Bestley, S., Wotherspoon, S., Harcourt, R. G., Lea, M.-A., . . . McMahon, C. R. (2017). Decadal changes in habitat characteristics influence population trajectories of southern elephant seals. Global Change Biology, 23(12), 5136-5150. doi:10.1111/gcb.13776

McMahon, C. R., Harcourt, R. G., Burton, H. R., Daniel, O., & Hindell, M. A. (2017). Seal mothers expend more on offspring under favourable conditions and less when resources are limited. Journal of Animal Ecology, 86(2), 359-370. doi:10.1111/1365-2656.12611

Figure 1

Decline in elephant seals at Macquarie Island (adapted from (Hindell et al., 2017), Global Change Biology, hatched areas are period with satellite environmental data).

Figure 2

A Weddell seal in the Ross Sea sports a Conductivity, Temperature and Depth Satellite Relay Data Logger (Photo Clive R. McMahon).

Figure 3

67 seal tracks colour coded by specialist group; Red = Victoria Land Coast, Black = Sub-Antarctic; Blue = Ross Sea (adapted from (Hindell et al., 2017).

Figure 4

Mean seal residence time per 50 km x 50 km grid, with a colour scale ranging from 4.5 hr to 327 hr. APF is Antarctic Polar Front; SAF is Sub-Antarctic Front, STF is Sub-Tropical Front (adapted from (Hindell et al., 2017) , Global Change Biology).

Download this Time Series Report

Citing this report: 

McMahon C, Harcourt R, Hindell M. (2020) Tracking elephant seal population trends in the Southern Ocean. In Richardson A.J, Eriksen R, Moltmann T, Hodgson-Johnston I, Wallis J.R. (Eds). State and Trends of Australia’s Ocean Report. doi: 10.26198/5e16b1ec49e8d

doi: 10.26198/5e16b1ec49e8d

Access the Data

Access the data that contributes to this time-series by clicking the icons below

08b. Animal tagging-02

Animal Tagging

Citing the Report

Richardson A.J, Eriksen R, Moltmann T, Hodgson-Johnston I, Wallis J.R. (2020). State and Trends of Australia’s Ocean Report, Integrated Marine Observing System (IMOS).

IMOS_logo-stacked-reversed-01

The State and Trends of Australia's Ocean Report was supported by IMOS. IMOS gratefully acknowledges the additional support provided by the Commonwealth Scientific and Industrial Research Organisation (CSIRO).

The State and Trends of Australia's Ocean website is maintained by IMOS.


NCRIS-PROVIDER-REV

Australia’s Integrated Marine Observing System (IMOS) is enabled by the National Collaborative Research Infrastructure Strategy (NCRIS). It is operated by a consortium of institutions as an unincorporated joint venture, with the University of Tasmania as Lead Agent.

Disclaimer:

You accept all risks and responsibility for losses, damages, costs and other consequences resulting directly or indirectly from using this site and any information or material available from it. While the Integrated Marine Observing System (IMOS) has taken reasonable steps to ensure that the information on this website and related publication is correct, it provides no warranty or guarantee that information provided by the authors is accurate, complete or up-to-date. IMOS does not accept any responsibility or liability for any actions taken as a result of, or in reliance on, information on its website or publication. Users should check with the originating authors to confirm the accuracy of the information before taking any action in reliance on that information.

If you believe any information on this website or in the related publication is inaccurate, out of date or misleading, please bring it to our attention by contacting the authors directly or emailing us at IMOS@imos.org.au


Images and Information:

All information on this website remains the property of those who authored it. All images on this website are licensed through Adobe Stock, Shutterstock, or have permission from the original owner.