Biological Time Series - Productivity

2.2

Spatial and seasonal trends in net primary production

Contributors

Peter Thompson1

Karlie McDonald1

1 CSIRO Oceans and Atmosphere, Hobart, TAS, Australia

Key Information

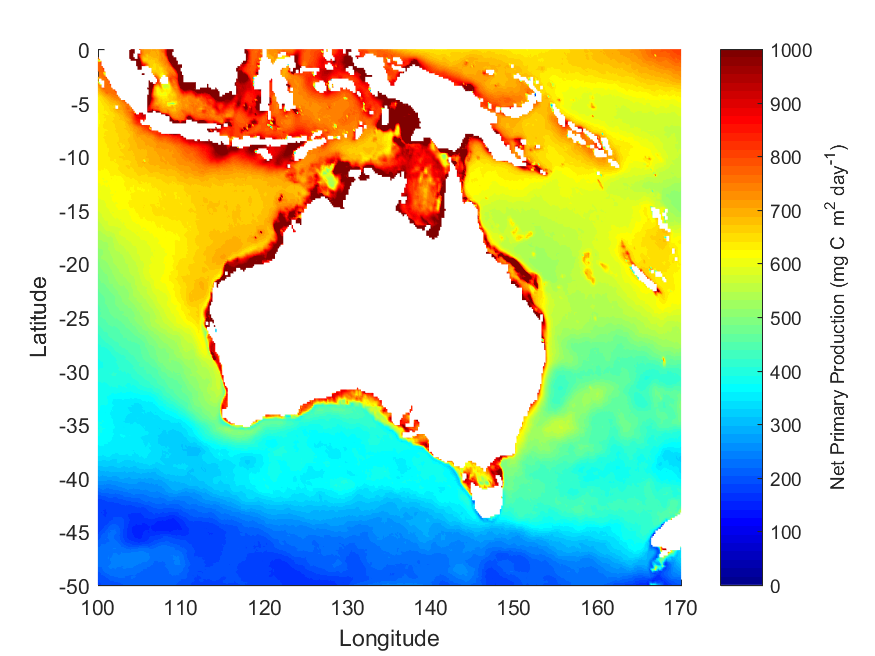
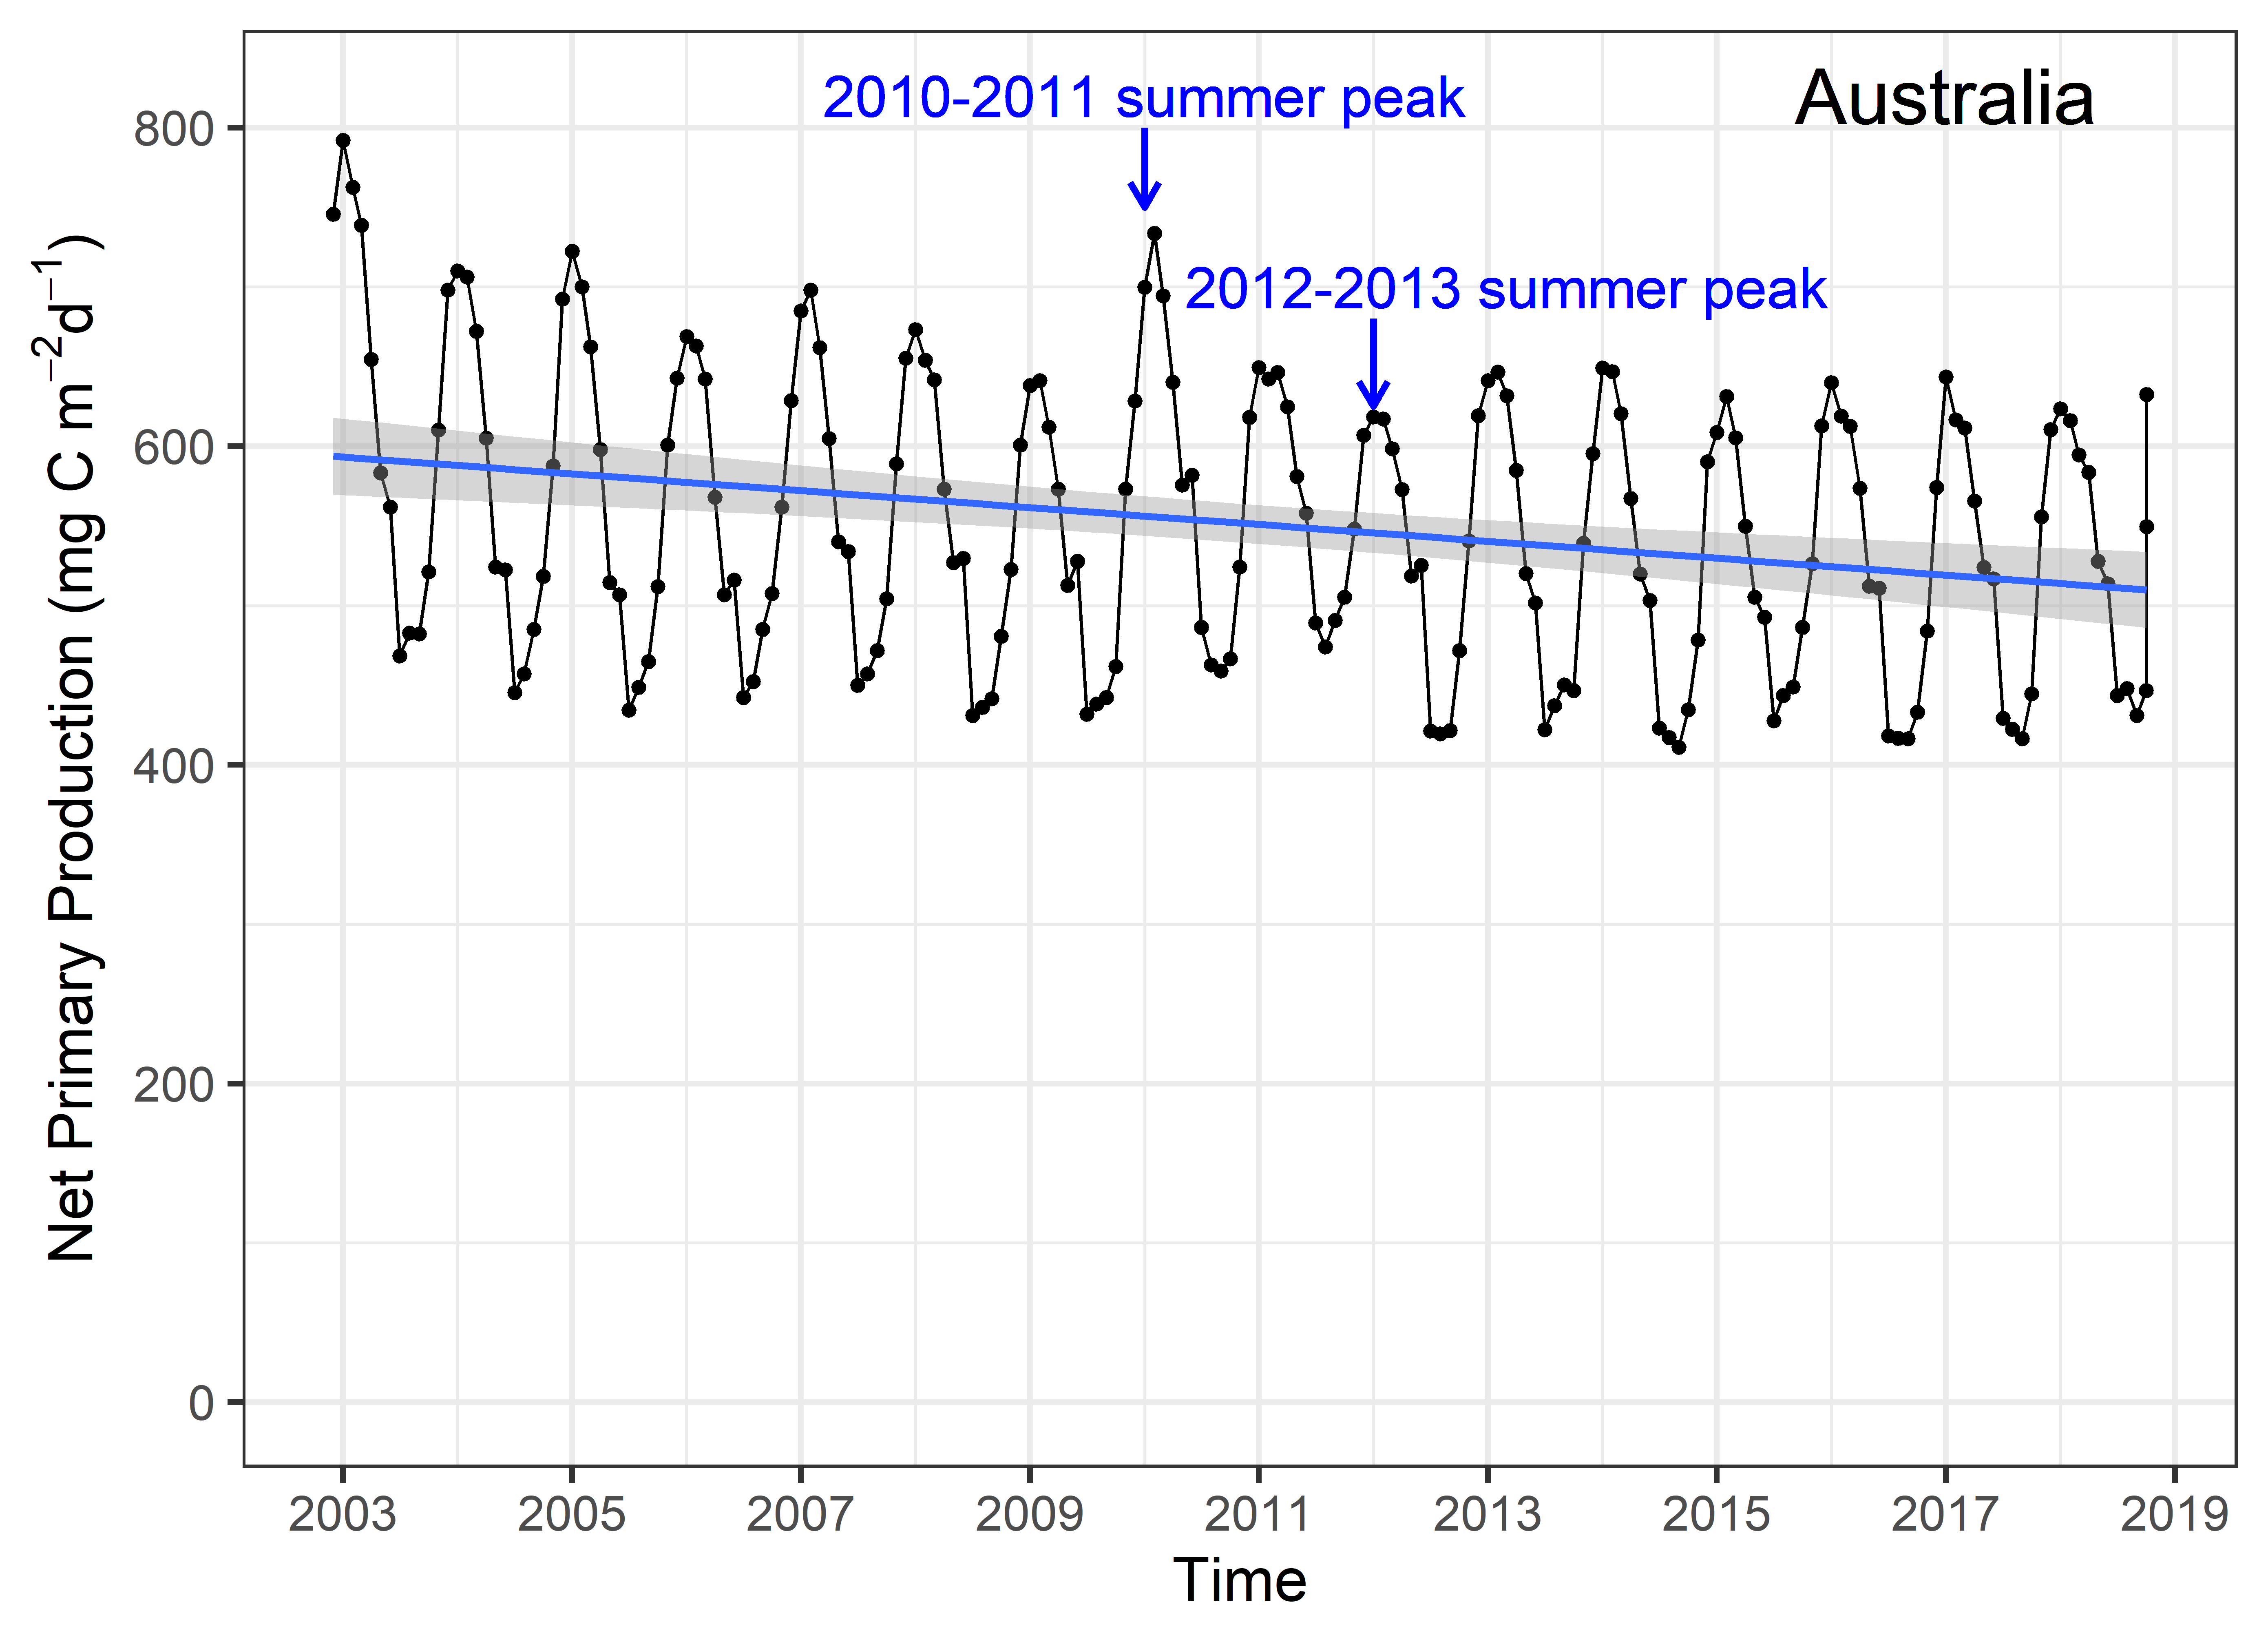
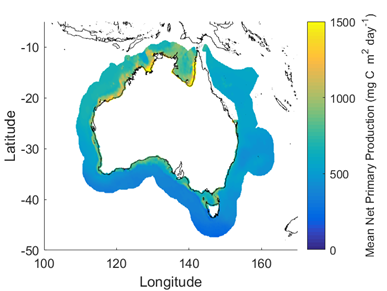
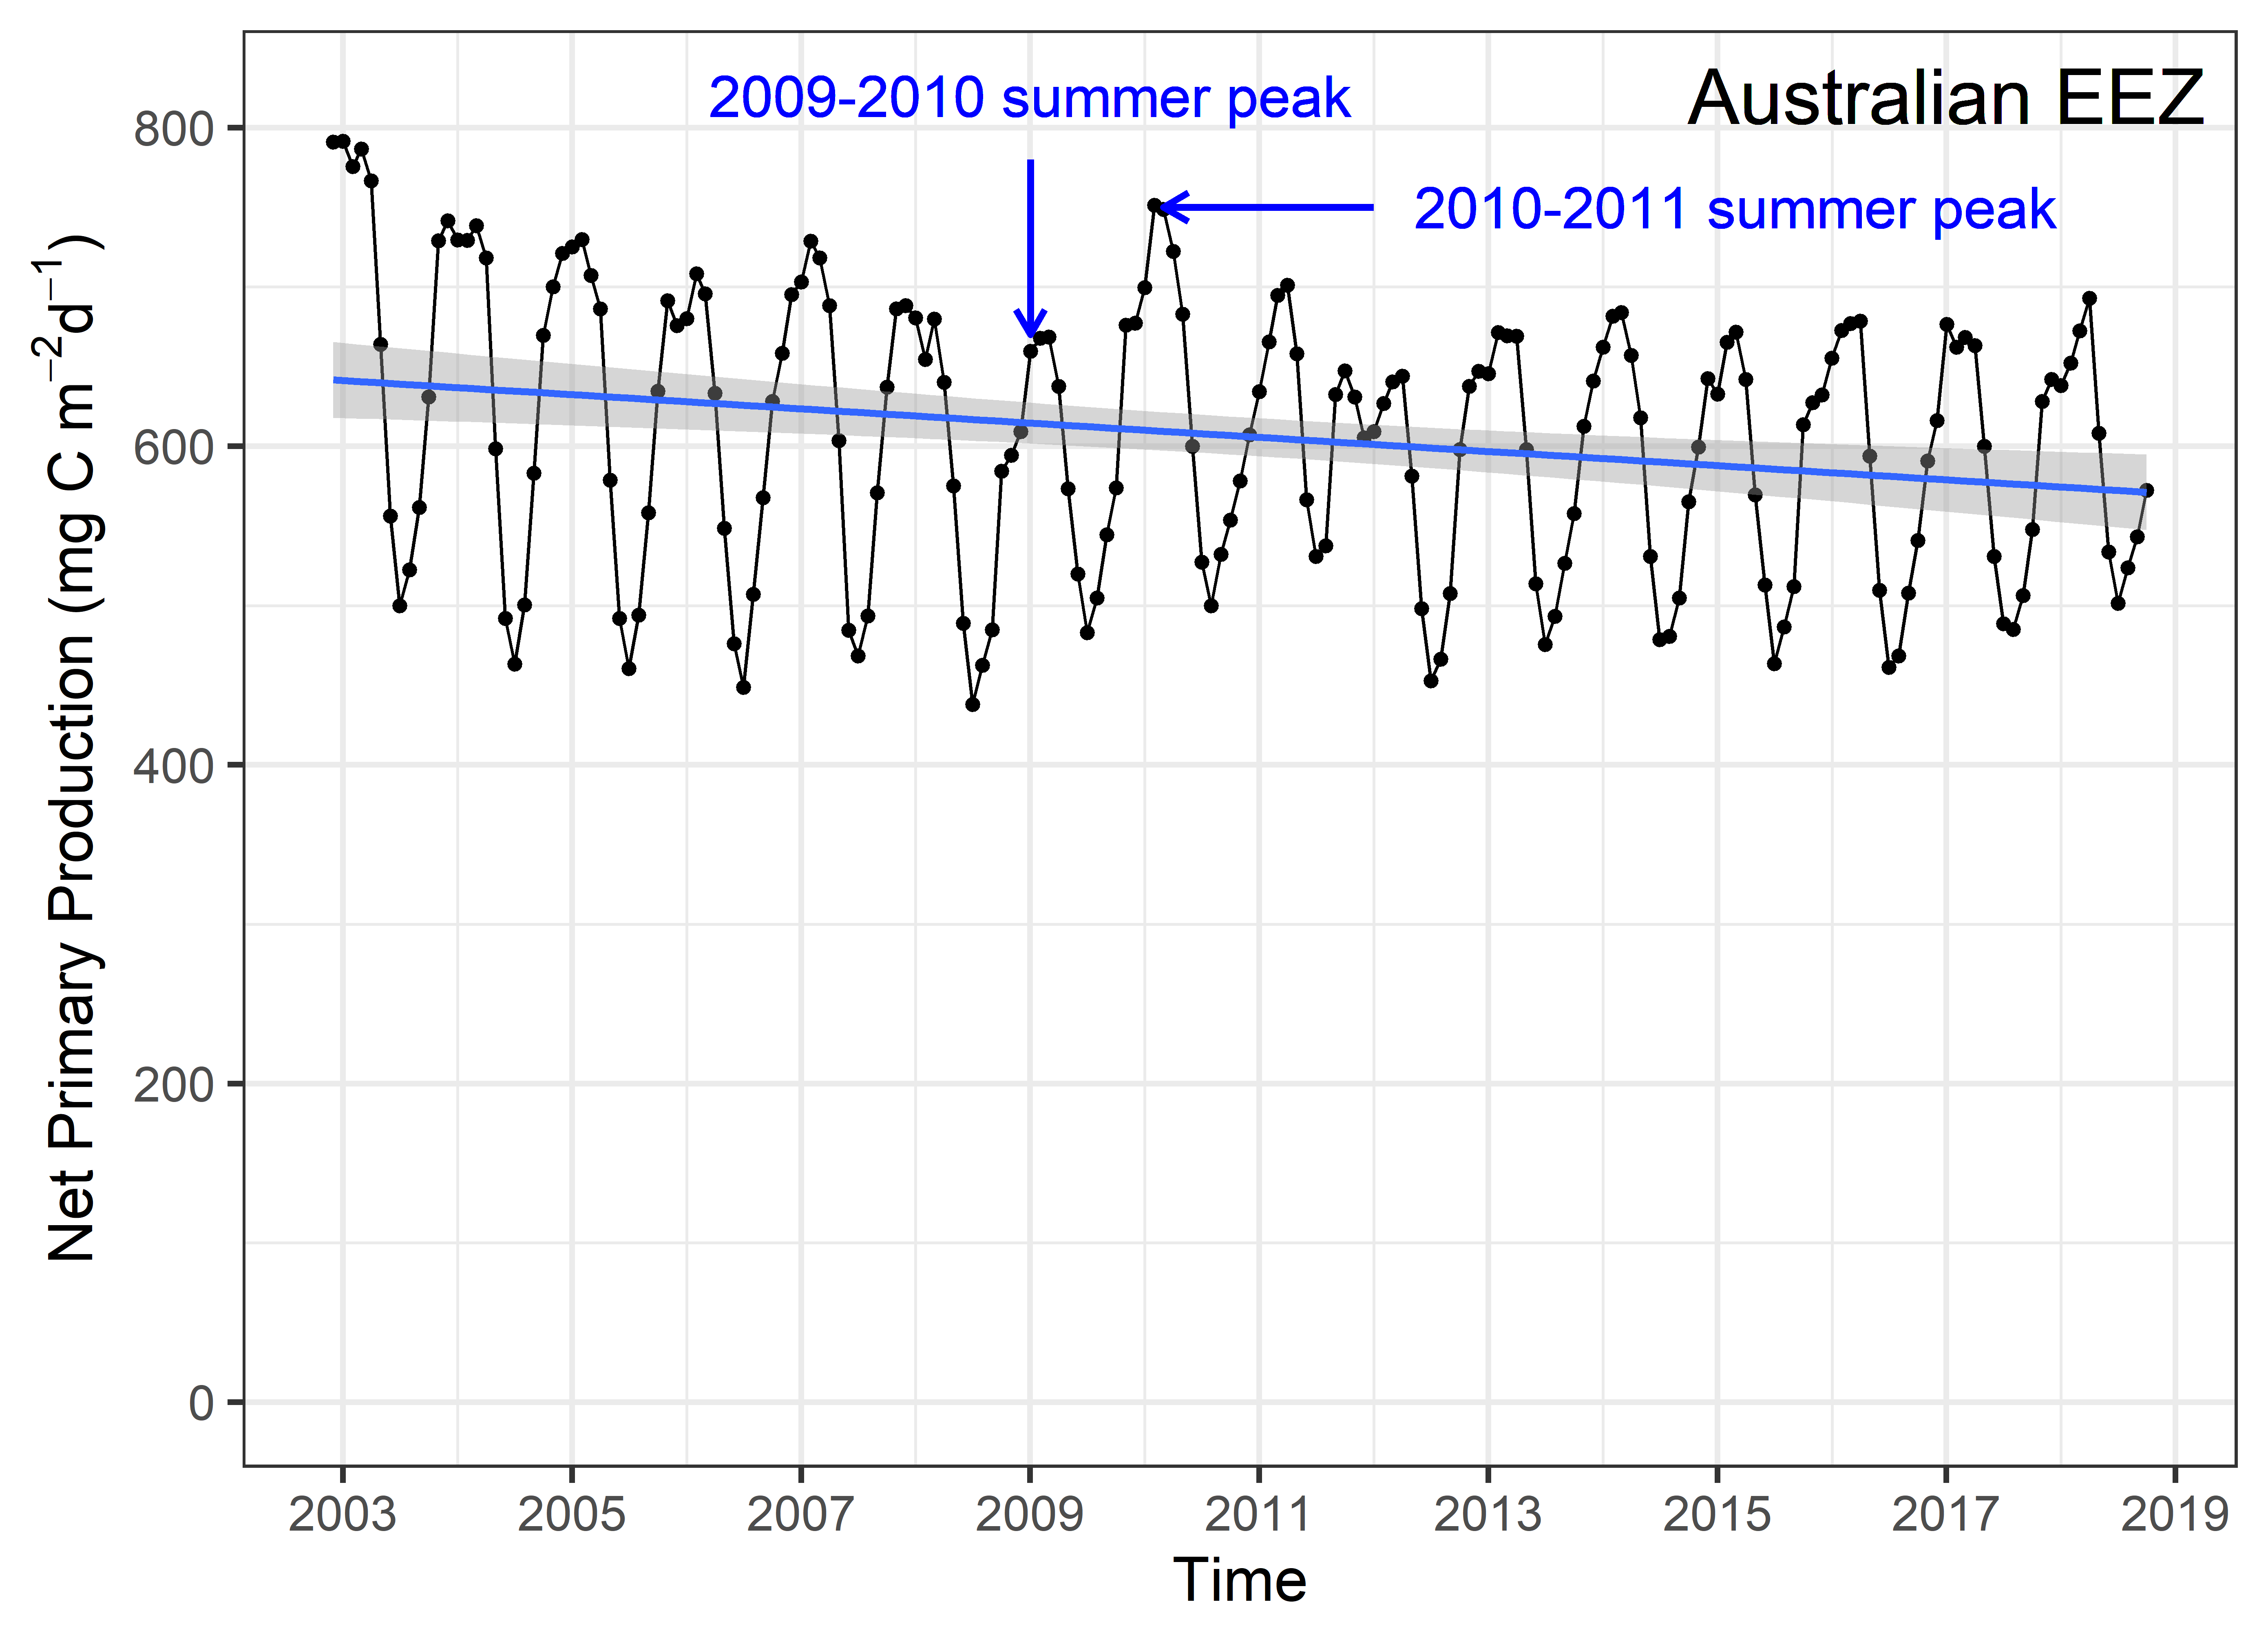
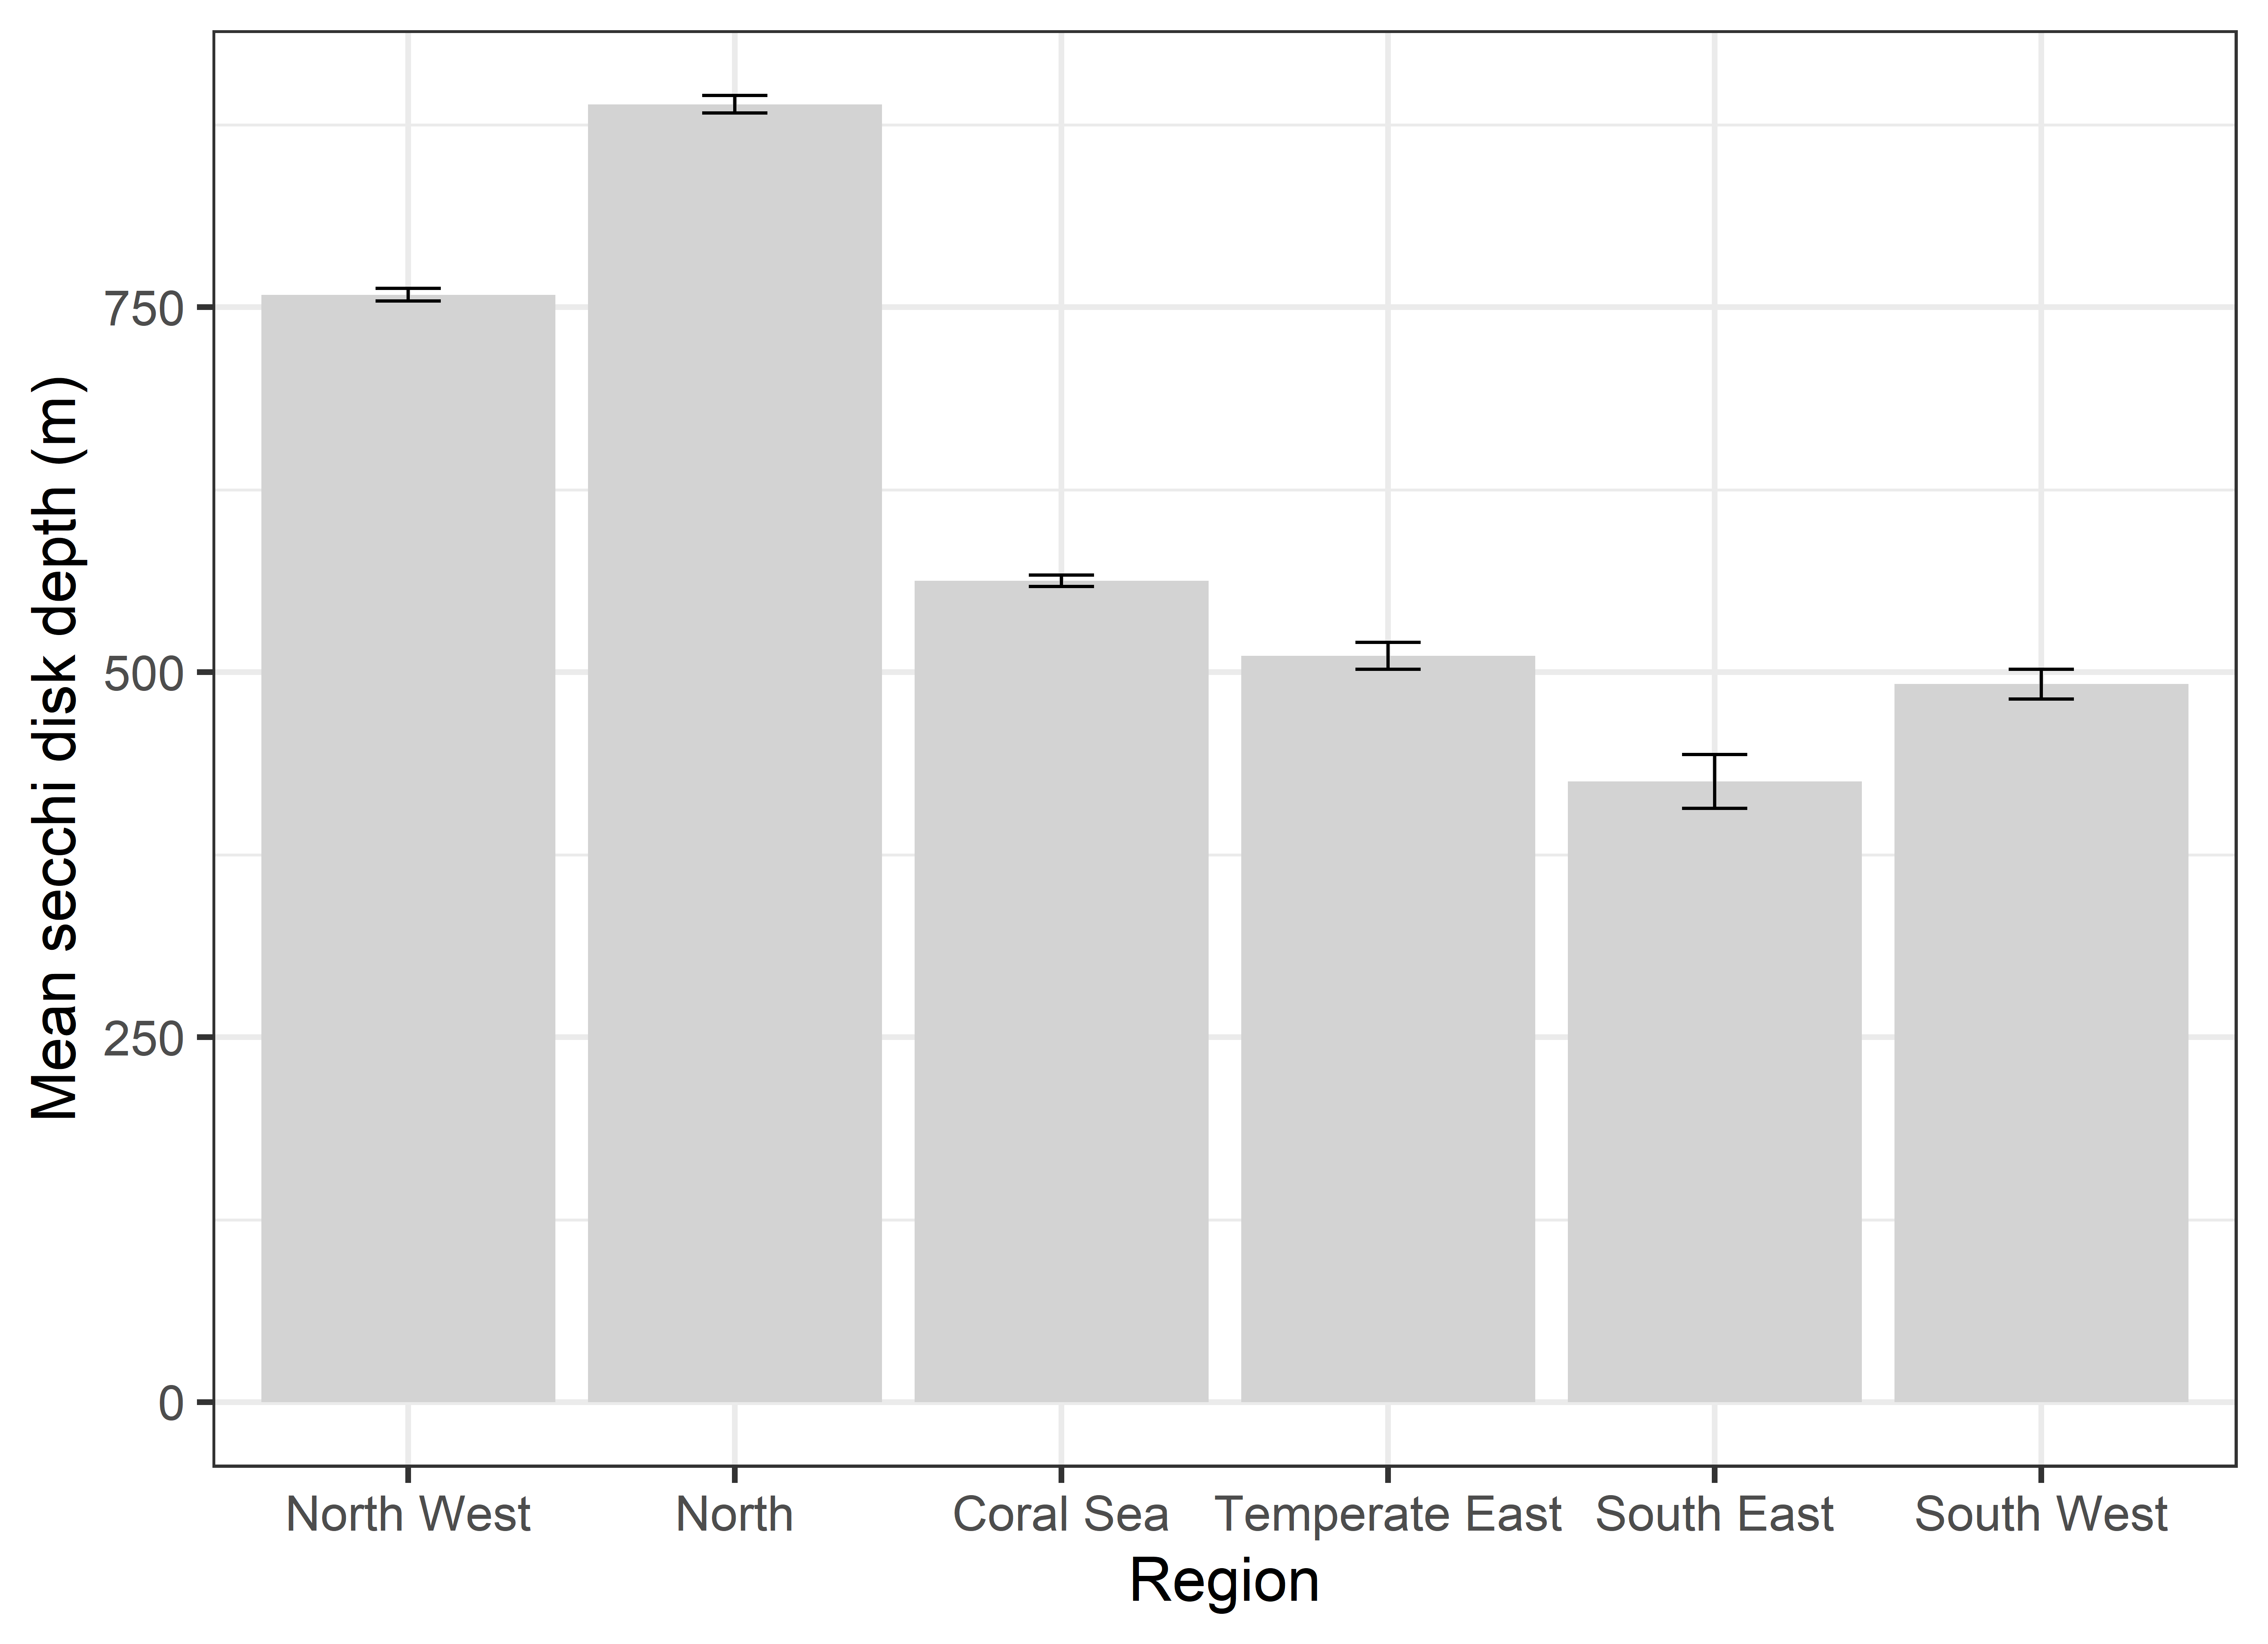
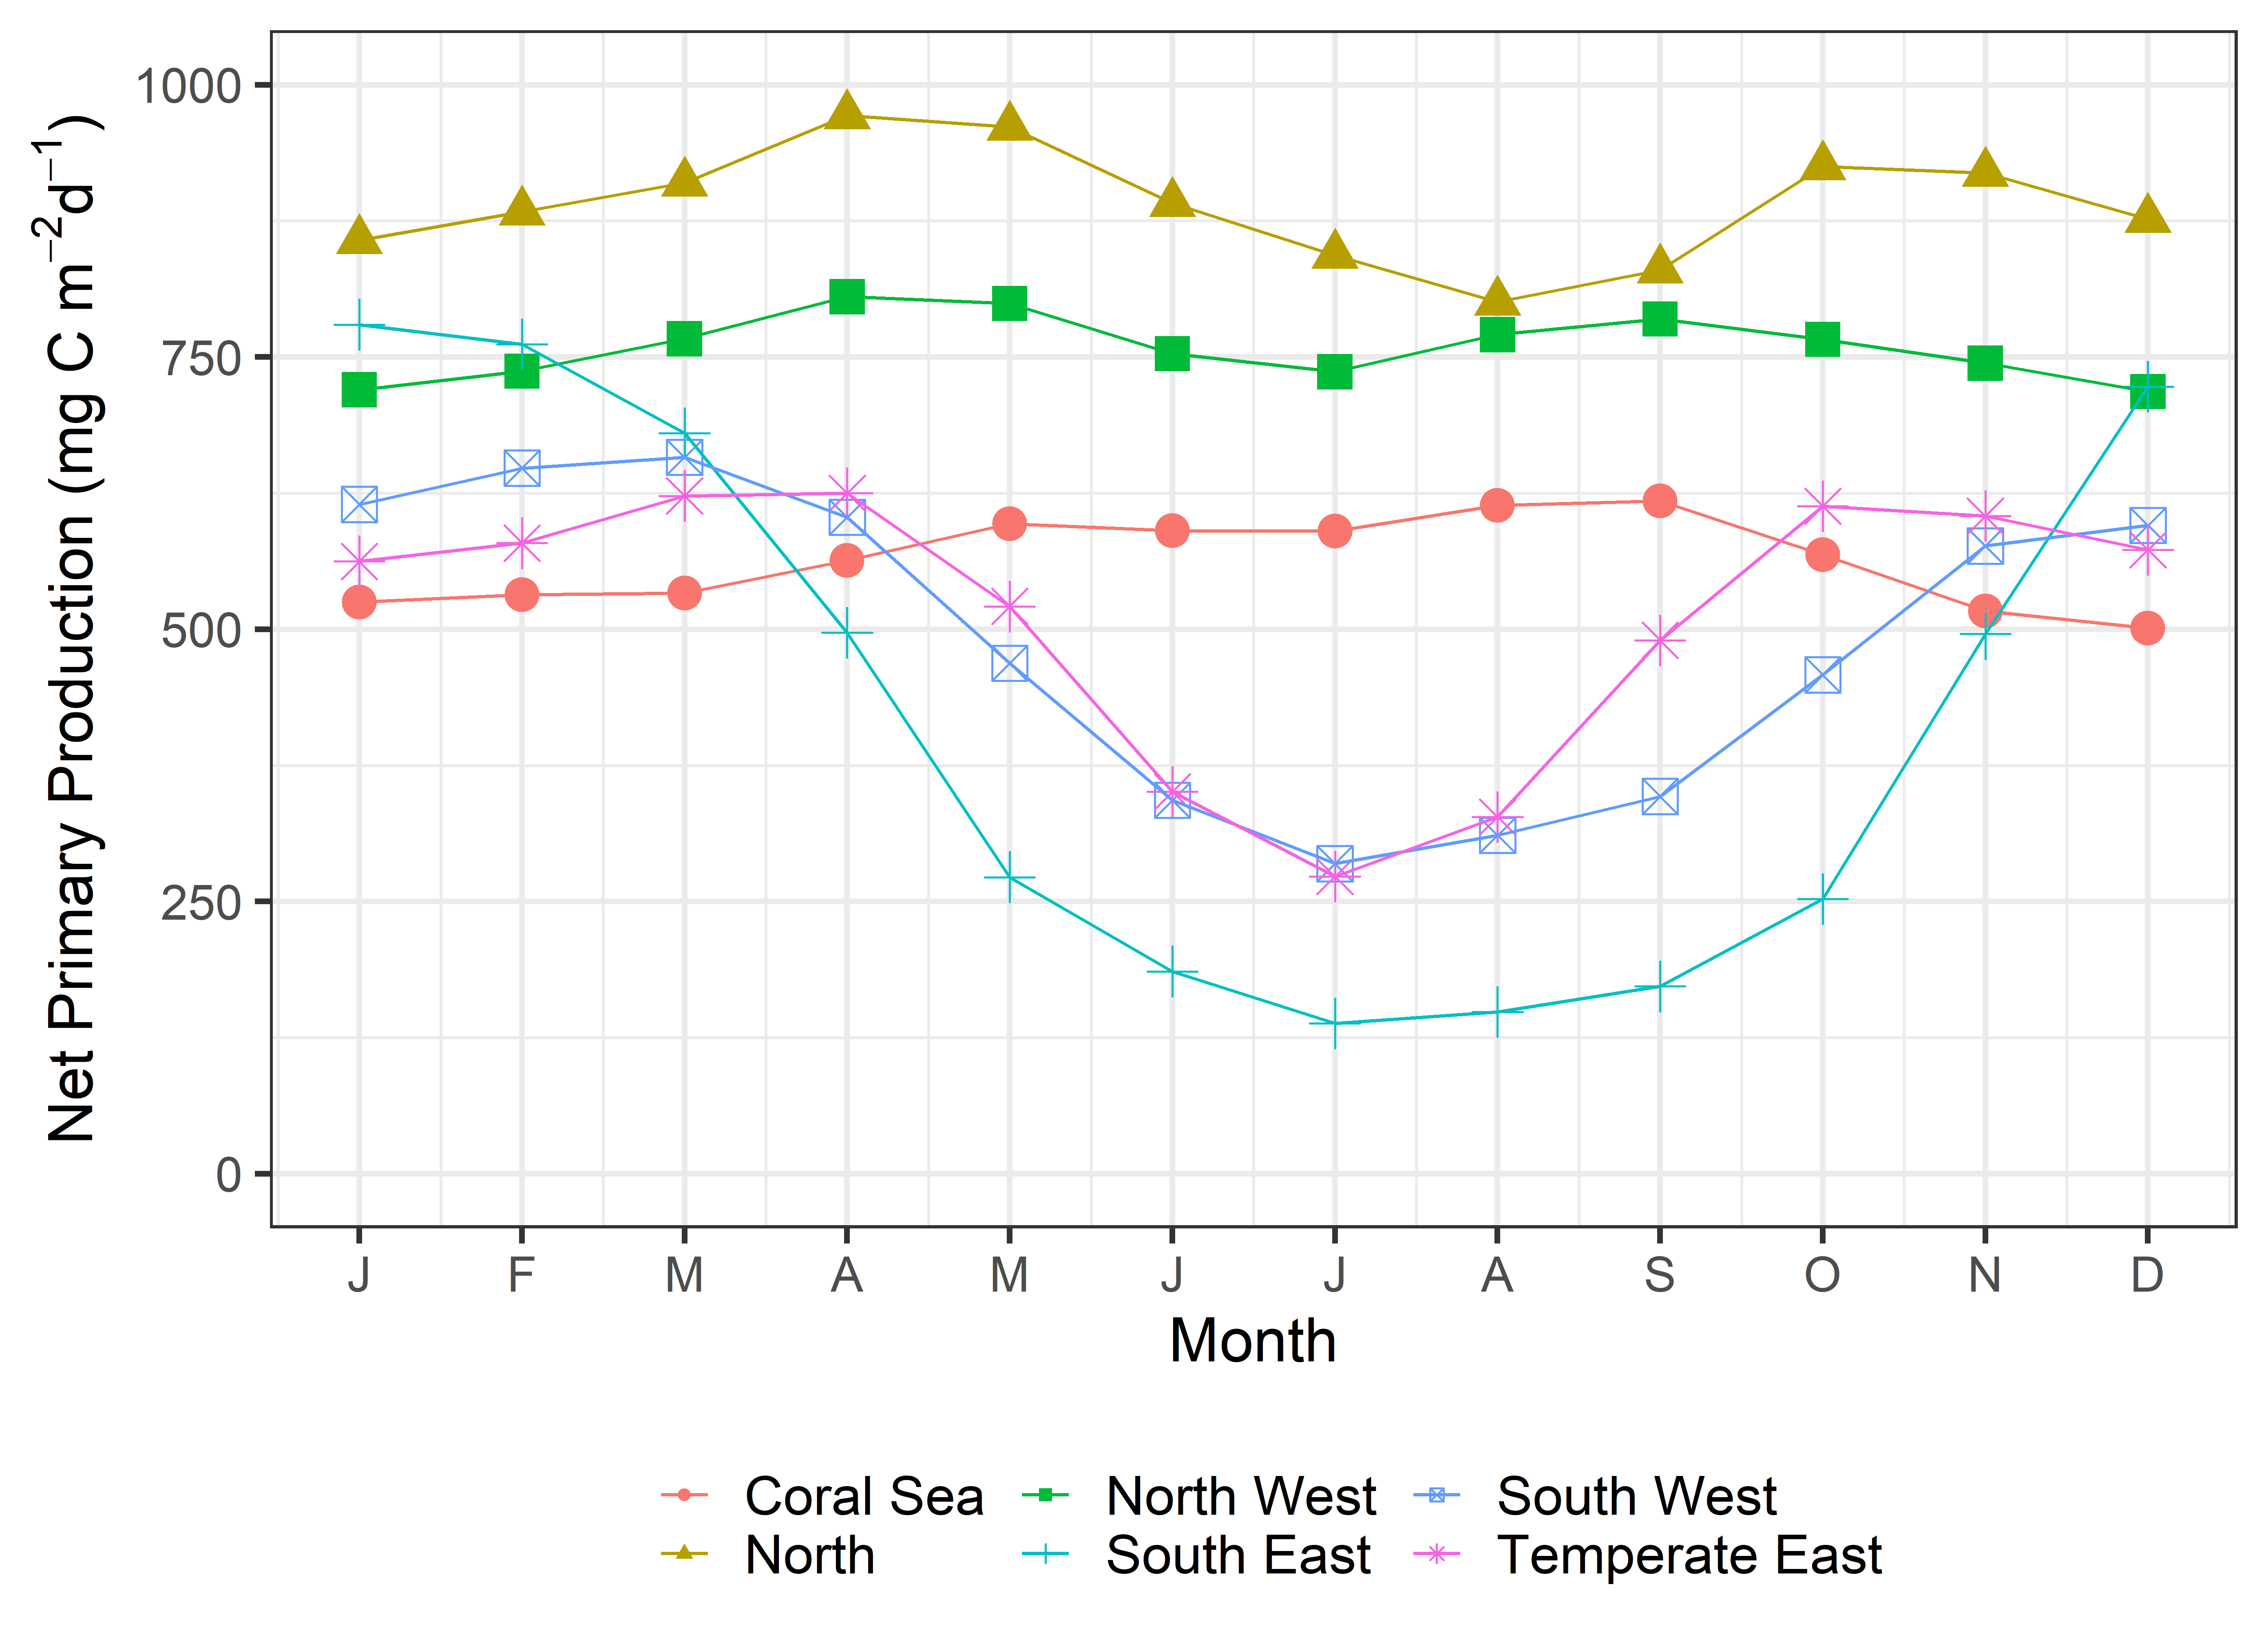
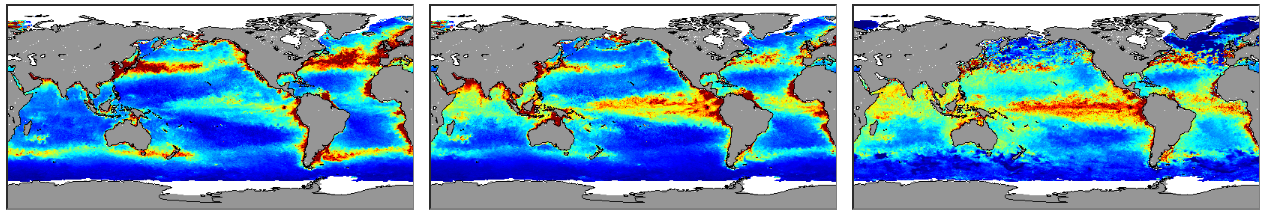
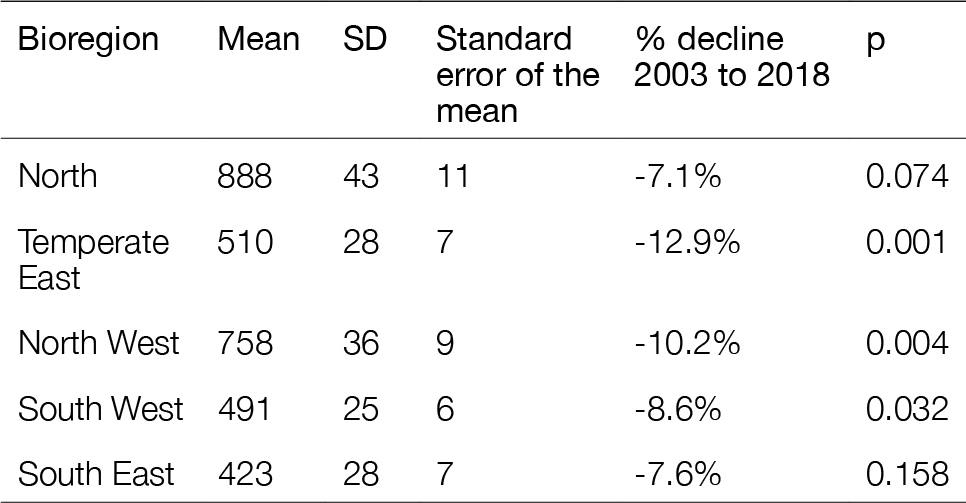
Net primary productivity varies greatly around Australia, with highest rates in coastal zones and in seas between Australia and its northern neighbours. Although there is a strong seasonal trend, increasing during spring-summer and decreasing in autumn-winter, average net primary productivity has declined in Australian waters by 12 % in the past 17 years (2002-2019). Given that primary production sets the carrying capacity of higher trophic levels (zooplankton, fish, birds and mammals), this decrease is likely to cause a reduction in the size of Australia’s fisheries.

Keywords

secchi disk depth, carbon-based, variability

Spatial and seasonal trends in net primary production

Plants use sunlight to grow and this growth supports all animal life. The growth is often measured as the conversion of carbon dioxide (CO2) into plant biomass (= primary production) per unit time. Total net primary production on Earth exceeds 100 billion tons of carbon per year and plays a profound role in the global carbon cycle. Phytoplankton in the oceans provide almost half of this productivity. Satellites have made it possible to have much more precise estimates of global primary production because of their ability to observe the entire planet every few days. The productivity of phytoplankton in our ocean pastures regulates the abundance of fish.

Although there are direct measurements of primary production from Australian waters (Everett & Doblin, 2015; Furnas & Carpenter, 2014; Jitts, 1967; Lourey et al., 2013; McLaughlin et al., 2019; Waite et al., 2007), they do not provide comprehensive spatial resolution or interannual resolution. Therefore, we are reliant on data from satellites. Converting satellite estimates of phytoplankton biomass derived from ocean colour to chlorophyll a and into primary production uses conceptual and mathematical models that originated in the 1950s (Ryther, 1956; Ryther & Yentsch, 1957; Talling, 1957). A more recent model uses satellite-based estimates of phytoplankton carbon concentration (Behrenfeld et al., 2005) derived from light scattering properties (Behrenfeld & Boss, 2003, 2006; Durand & Olson, 1996; Green & Sosik, 2004; Green et al., 2003; Loisel et al., 2001; Stramski et al., 1999) and improved information on particulate backscattering coefficients, phytoplankton pigment absorption, and coloured dissolved organic carbon absorption (Garver & Siegel, 1997; Maritorena et al., 2002; Siegel et al., 2002). We use this carbon-based approach here. Data and further description of the methods can be found at http://www.science.oregonstate.edu/ocean.productivity/.

The mean net primary production across the Australian region between 2002 and 2019 was 551 mgC m-2d-1. This is a relatively low productivity, typical of healthy tropical and subtropical oceanic waters. Areas of higher net primary production in the region include the coastal zone and seas between Australia and its northern neighbours (Figure 1).

Across the Australian region, the net primary production (NPP) varied seasonally and inter-annually (Figure 2). NPP was elevated during the summer of 2009-10 and reduced in the summer of 2011-12 (Figure 2). There was, however, a significant (p<0.001) negative trend in NPP across this region. From 2002 to 2019, the mean annual NPP declined 12%.

Within Australia’s continental EEZ, the mean net primary production was 606 mgC m-2d-1. Net primary production was lower further south (Figure 3). Net primary production was greater in the coastal zone, the shallow seas between Australia and its northern neighbours, and through Bass Strait to Tasmania.

Similar to the broader regional trend, the net primary production in the Australian EEZ has declined significantly (p<0.0009) from 2002 to 2019 (Figure 4). The rate of decline was similar at 0.6% per year or ~10% over the elapsed period from 2002 to 2019. There was substantial inter-annual variation (Fig. 4). For example, summer 2009-10 was less productive than the summer of 2010-11 (Figure 4).

All six bioregions around the coast of Australia were significantly different from each other in terms of their net primary production (p<0.001), except for the Temperate East, which was not different from the South East (Figure 5). The North bioregion had the greatest primary production followed by the North West and then the Coral Sea. The three bioregions further south, Temperate East, South West and South East had lower primary production. Across all bioregions, the range in estimated primary production was a factor of ~2 between the North and South East regions (Table 1).

All bioregions showed seasonal variability in net primary production, with largest seasonal changes in more southern bioregions (Figure 6). The South East bioregion had the largest seasonal variation, with a relatively high mean primary production of ~800 mgC m-2d-1 during summer, declining to <200 mgC m-2d-1 during winter for an annual range of 642 mgC m-2d-1. The smallest average annual range of only 87 mgC m-2d-1 was in the North West bioregion, where there was a winter minimum followed by small spring and autumn increases in primary production.

rends in net primary production from 2002 to 2019 were negative in each of the six bioregions, although only statistically significant for four (the Coral Sea, Temperate East, South West, North West bioregions, Table 1). Rates of decline in net primary production ranged from 7-13% over 15 years across the 6 bioregions and averaged 9% overall or 0.6% per year across all bioregions. The rate of decline as a percent of total net primary production was greatest in the Temperate East and least in the North (Table 1).

Although there are few net primary production estimates in the Australian region, the North bioregion has been relatively well studied using conventional 14C measurements for primary production (Furnas & Carpenter 2016). These data, collected between 1990 and 2013, had a mean of 1048 ± 109 mgC m-2d-1 (mean ± 95% CI). Based on our results, the estimated mean for the entire region between 1990 and 2013 was 924 mgC m-2d-1, with monthly means that varied from 684 to 1165 mgC m-2d-1. Thus, estimates here from satellite and observed point estimates from 14C measurements are in reasonable agreement, given differences in spatial-temporal sampling.


From 2002 to 2019, there was a significant decline in net primary production in the continental EEZ and four of the six bioregions. Both the carbon-based model and the ocean colour-based model of primary production are likely to indicate significant declines in primary production. These downwards trends in primary production are also similar to those observed elsewhere using other observational methods such as long-term measurements by Secchi Disk (e.g. Falkowski & Wilson, 1992). This decline in primary production is consistent with the observed declines in chlorophyll a (see State and Trends of Australia’s Ocean Report 2.1: Spatial and seasonal trends in Chlorophyll a), phytoplankton abundance and phytoplankton biovolume (see State and Trends of Australia’s Ocean Report 2.3: Contrasting trends of Australia’s plankton communities).

The conventional understanding of primary production around Australia has changed dramatically in the last decade. Early estimates based on ocean colour from the coastal zone colour scanner, the SeaWiFs, and MODIS satellites e.g. (Behrenfeld & Falkowski, 1997) indicated that the greatest primary production was in the Tasman Sea (Figure 7). These early models have been widely used to estimate global primary production (e.g. (Field, Behrenfeld, Randerson, & Falkowski, 1998). Here net primary production was calculated based on the satellite-derived measures of phytoplankton carbon. This carbon-based approach is considered an improvement (Behrenfeld & Boss, 2003, 2006) . Using the new temperature-corrected and carbon-based model suggests northern Australian waters are more productive than previously thought (Figure 7). The new approach estimates the North bioregion has the greatest annual primary production at 324 gC m-2y-1 and Southeast bioregion with the least at only 154 gC m-2y-1 (Table 1).

All the Australian bioregions had estimated primary production values within ±100 gC m-2d-1 of the global mean of measurements from 131 coastal or estuarine water bodies of 252 gC-2d-1 (Cloern et al., 2014). The relatively high measured values of primary production using 14C from the North (e.g. Furnas & Carpenter, 2014) would suggest that newer carbon-based models (Behrenfeld & Boss, 2003, 2006) provide better estimates of primary production in our northern waters than models based on ocean colour. At this time there are no data to substantiate whether these new models are also better for the Tasman Sea.

Behrenfeld, M. J., & Boss, E. (2003). The beam attenuation to chlorophyll ratio: an optical index of phytoplankton physiology in the surface ocean? Deep-Sea Research Part I-Oceanographic Research Papers, 50(12), 1537-1549. doi:10.1016/j.dsr.2003.09.002

Behrenfeld, M. J., & Boss, E. (2006). Beam attenuation and chlorophyll concentration as alternative optical indices of phytoplankton biomass. Journal of Marine Research, 64(3), 431-451. doi:10.1357/002224006778189563

Behrenfeld, M. J., Boss, E., Siegel, D. A., & Shea, D. M. (2005). Carbon-based ocean productivity and phytoplankton physiology from space. Global Biogeochemical Cycles, 19.

Behrenfeld, M. J., & Falkowski, P. G. (1997). A consumer's guide to phytoplankton primary productivity models. Limnology and Oceanography, 42(7), 1479-1491. doi:10.4319/lo.1997.42.7.1479

Cloern, J. E., Foster, S. Q., & Kleckner, A. E. (2014). Phytoplankton primary production in the world's estuarine-coastal ecosystems. Biogeosciences, 11(9), 2477-2501. doi:10.5194/bg-11-2477-2014

Durand, M. D., & Olson, R. J. (1996). Contributions of phytoplankton light scattering and cell concentration changes to diel variations in beam attenuation in the equatorial Pacific from flow cytometric measurements of pico-, ultra- and nanoplankton. Deep-Sea Research Part Ii-Topical Studies in Oceanography, 43(4-6), 891-906. doi:10.1016/0967-0645(96)00020-3

Everett, J. D., & Doblin, M. A. (2015). Characterising primary productivity measurements across a dynamic western boundary current region. Deep-Sea Research Part I-Oceanographic Research Papers, 100, 105-116. doi:10.1016/j.dsr.2015.02.010

Falkowski, P. G., & Wilson, C. (1992). Phytoplankton productivity in the North Pacific ocean since 1900 and implications for absorption of anthropogenic CO2. Nature, 358(6389), 741-743. doi:10.1038/358741a0

Field, C. B., Behrenfeld, M. J., Randerson, J. T., & Falkowski, P. (1998). Primary production of the biosphere: Integrating terrestrial and oceanic components. Science, 281(5374), 237-240. doi:10.1126/science.281.5374.237

Furnas, M. J., & Carpenter, E. J. (2014). Primary production in the tropical continental shelf seas bordering northern Australia. Continental Shelf Research, 129, 33-48. doi:10.1016/j.csr.2016.06.006

Garver, S. A., & Siegel, D. A. (1997). Inherent optical property inversion of ocean color spectra and its biogeochemical interpretation .1. Time series from the Sargasso Sea. Journal of Geophysical Research-Oceans, 102(C8), 18607-18625. doi:10.1029/96jc03243

Green, R. E., & Sosik, H. M. (2004). Analysis of apparent optical properties and ocean color models using measurements of seawater constituents in New England continental shelf surface waters. Journal of Geophysical Research-Oceans, 109(C3), 17. doi:10.1029/2003jc001977

Green, R. E., Sosik, H. M., & Olson, R. J. (2003). Contributions of phytoplankton and other particles to inherent optical properties in New England continental shelf waters. Limnology and Oceanography, 48(6), 2377-2391. doi:10.4319/lo.2003.48.6.2377

Jitts, H. R. (1967). Seasonal variations in the Indian Ocean along 110°E IV. Primary Production. Australian Journal Marine and Freshwater Research, 20, 65-75.

Loisel, H., Bosc, E., Stramski, D., Oubelkheir, K., & Deschamps, P. Y. (2001). Seasonal variability of the backscattering coefficient in the Mediterranean Sea based on Satellite SeaWiFS imagery. Geophysical Research Letters, 28(22), 4203-4206. doi:10.1029/2001gl013863

Lourey, M. J., Thompson, P. A., McLaughlin, M. J., Bonham, P., & Feng, M. (2013). Primary production and phytoplankton community structure during a winter shelf-scale phytoplankton bloom off Western Australia. Marine Biology, 160(2), 355-369. doi:10.1007/s00227-012-2093-4

Maritorena, S., Siegel, D. A., & Peterson, A. R. (2002). Optimization of a semianalytical ocean color model for global-scale applications. Applied Optics, 41(15), 2705-2714. doi:10.1364/ao.41.002705

Figure 1

Estimated mean net primary production (mgC m-2 d-1) for the Australian region (0-50°S and 100-170°E) from December 2002 to January 2019.

Figure 2

Estimated mean monthly net primary production (mgC m-2 d-1) for the Australian region (0-50°S and 100-170°E) from December 2002 to January 2019. Strong seasonal, inter-annual and long-term variability are evident (grey ellipses show differences between peak primary production in 2010-11 and 2012-13), with the long-term trend estimated as significantly negative (P<0.001).

Figure 3

Estimated mean net primary production (mgC m-2 d-1) for the Australian EEZ for December 2002 to January 2019.

Figure 4

Estimated mean monthly net primary production (mgC m-2 d-1) for the Australian EEZ for December 2002 to January 2019. Strong seasonal, inter-annual and long-term variability are evident (grey ellipses show differences between peak primary production in 2009-10 and 2010-11) with the long-term trend estimated as significantly negative (P<0.0009).

Figure 5

Estimated mean annual net primary production for the six bioregions around Australia (mean ± standard error).

Figure 6

The average monthly net primary production for the six bioregions around Australia.

Figure 7

Modified from http://www.science.oregonstate.edu/ocean.productivity/custom.php. (accessed May 17 2019). All panels show estimated net primary production (NPP) with blue (= low) to red (= high) derived from MODIS satellite data. The Left panel shows conventional NPP, the centre panel shows temperature adjusted NPP, the right panel is NPP from a spectral and depth resolved carbon-based model.

Table 1

Mean 2003-2018 daily net primary production in each bioregion (mgC m-2 d-1), its overall decline, and the probability the rate of decline is zero (p).

Download this Time Series Report

Citing this report: 

Thompson P, McDonald K. (2020). Spatial and seasonal trends in net primary production. In Richardson A.J, Eriksen R, Moltmann T, Hodgson-Johnston I, Wallis J.R. (Eds). State and Trends of Australia’s Ocean Report. doi: 10.26198/5e16a4a749e7a

doi: 10.26198/5e16a4a749e7a

Access the Data

Access the data that contributes to this time-series by clicking the icons below

11. SRS-02

Satellite Remote Sensing

Citing the Report

Richardson A.J, Eriksen R, Moltmann T, Hodgson-Johnston I, Wallis J.R. (2020). State and Trends of Australia’s Ocean Report, Integrated Marine Observing System (IMOS).

IMOS_logo-stacked-reversed-01

The State and Trends of Australia's Ocean Report was supported by IMOS. IMOS gratefully acknowledges the additional support provided by the Commonwealth Scientific and Industrial Research Organisation (CSIRO).

The State and Trends of Australia's Ocean website is maintained by IMOS.


NCRIS-PROVIDER-REV

Australia’s Integrated Marine Observing System (IMOS) is enabled by the National Collaborative Research Infrastructure Strategy (NCRIS). It is operated by a consortium of institutions as an unincorporated joint venture, with the University of Tasmania as Lead Agent.

Disclaimer:

You accept all risks and responsibility for losses, damages, costs and other consequences resulting directly or indirectly from using this site and any information or material available from it. While the Integrated Marine Observing System (IMOS) has taken reasonable steps to ensure that the information on this website and related publication is correct, it provides no warranty or guarantee that information provided by the authors is accurate, complete or up-to-date. IMOS does not accept any responsibility or liability for any actions taken as a result of, or in reliance on, information on its website or publication. Users should check with the originating authors to confirm the accuracy of the information before taking any action in reliance on that information.

If you believe any information on this website or in the related publication is inaccurate, out of date or misleading, please bring it to our attention by contacting the authors directly or emailing us at IMOS@imos.org.au


Images and Information:

All information on this website remains the property of those who authored it. All images on this website are licensed through Adobe Stock, Shutterstock, or have permission from the original owner.