Biological Time Series - Marine Animals

4.6

Temporal and spatial changes in larval fish

Contributors

Ana Lara-Lopez1,2

Charlie Hinchliffe3

Iain M. Suthers4

Anthony J. Richardson5,6

Paloma A. Matis4 ,7

1 Integrated Marine Observing System (IMOS), University of Tasmania, Hobart, TAS, Australia
2 Institute for Marine and Antarctic Studies, University of Tasmania, Hobart, TAS, Australia
3 School of Life Sciences, University of Technology Sydney, Broadway, NSW, Australia
4 Sydney Institute of Marine Science, Building 19, Chowder Bay Road, Mosman, NSW , Australia
5 CSIRO Oceans and Atmosphere, Queensland Biosciences Precinct (QBP), St Lucia, QLD, , Australia
6 Centre for Applications in Natural Resource Mathematics (CARM), School of Mathematics and Physics, The University of Queensland, St Lucia, QLD, Australia
7 Evolution and Ecology Research Centre, University of New South Wales, Sydney, NSW , Australia

Key Information

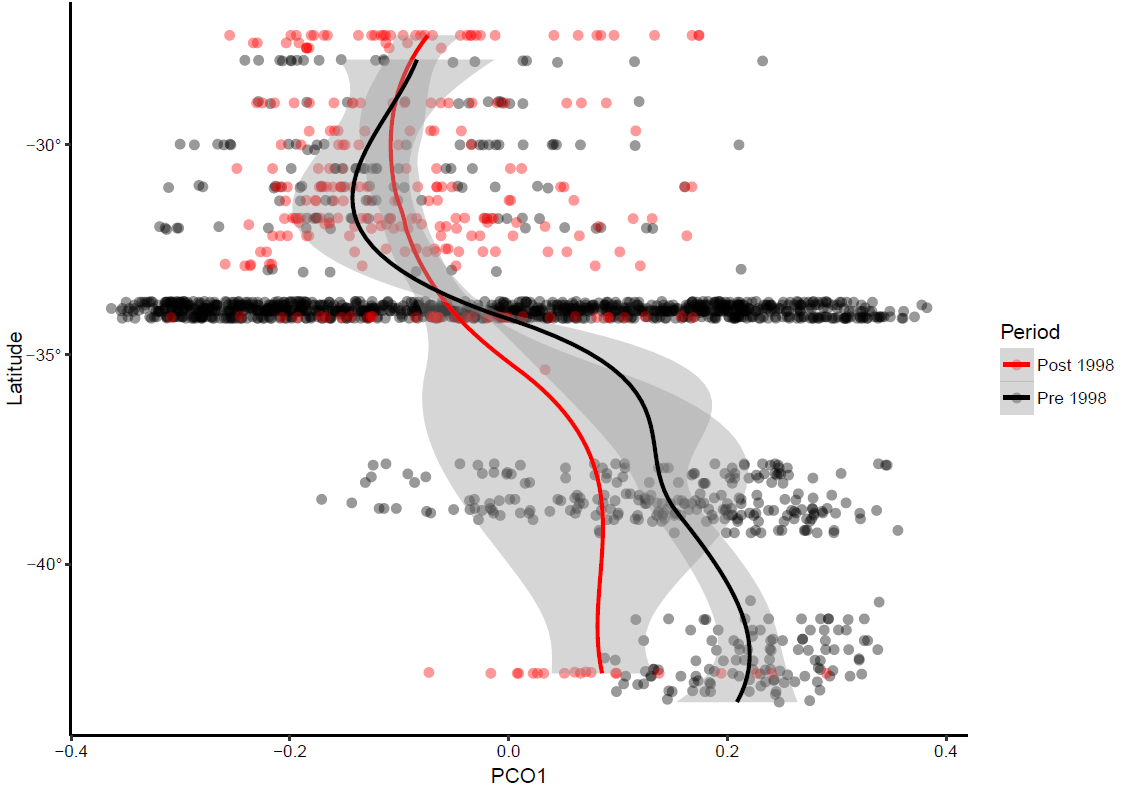
Historical data and contemporary larval fish observations from the IMOS larval fish monitoring along the East Coast of Australia indicate the EAC may be affecting the larval fish community composition by distributing warm-water communities further south. This restructuring of the larval fish community is an expected impact of climate change that can have ecological and economic implications for the region.

Keywords

East Australian Current, fish community, species richness, larval fish monitoring program

Temporal and spatial changes in larval fish

Most marine fish inhabit the upper water column during their early life, with eggs and larvae developing as part of the plankton. During this early life stage, fish are sensitive to environmental changes, with many oceanographic, biological and anthropogenic processes (e.g., eutrophication, pollution, climate change and fisheries) influencing their distribution, abundance and survival (Cowen et al., 2007, Hsieh et al., 2006, Keane and Neira, 2008). This makes the monitoring of larval fish a valuable tool for assessing ecosystem changes, and a relatively low-cost and efficient means for monitoring fish populations and communities (Koslow and Couture, 2013, Koslow and Wright, 2016). Larval fish time-series can reflect long-term changes in the fish community, including the influence of large-scale oceanographic drivers of fish species distributions (Booth et al., 2011, Last et al., 2011, Vergés et al., 2016), and may also provide a valuable fishery-independent indicator of stock size and stock boundarie (Leis and McGrouther, 1996). Here we combine historical data on fish larval abundance, diversity and distribution with contemporary data from the IMOS program to investigate the distribution of larval abundance and richness down the east coast of Australia. We analyse seasonal changes in the latitudinal distribution of larval fish abundance and richness down the east coast. We also investigate whether climate change is having an effect on larval fish distributions by comparing the distribution of richness down the east coast before 1998 with the contemporary estimates after 1998. Our hypothesis is that as climate change has strengthened the East Australian Current (EAC (Ridgway, 2007, Ridgway et al., 2008), larval fish communities should be more similar down the east coast now than in previous years (see Section on “Using zooplankton communities to estimate the relative strength of the East Australian Current” by Rochester et al. for a similar investigation).

We analysed data on larval fish assemblages from 11 surveys and programs from 1983-present in temperate and subtropical Australian pelagic waters (Figure 1). Samples were collected on the continental shelf (<200 m) and fish larvae were classified to the lowest possible taxonomic resolution. Historical data were compared with modern data from IMOS National Reference Stations (NRS) at Maria Island, Port Hacking and Stradbroke Island since 2009 off the east coast of Australia (Smith et al., 2018). Data were sourced from (Smith et al., 2018),  the updated dataset will be available in the AODN (https://portal.aodn.org.au/ in the near future.

We used generalised additive models to explore how spatial patterns in larval fish abundance and richness changed through time, using season and latitude as covariates. To assess changes in the larval community, we used Principal Coordinates Analysis on a square-root transformed Bray-Curtis dissimilarity matrix of larval fish assemblages, after removing rare species.

Larval fish density was generally lower off the west coast, and higher off the east coast of Australia (Figure 2). In the west highest densities were off Perth, and in the east highest densities were off the New South Wales coast.

There was a strong latitudinal trend in species richness in most seasons, with higher species richness in tropical northern regions and a steep decline in abundance south of 30°S (Figure 3). This decline in richness with increasing latitude is typical for most species (Chaudhary et al., 2017).

The only season that did not show this decline in richness with latitude was summer when species richness appears to be more similar down the east coast (Figure 3a). This is likely due to local spawning during summer near Tasmania, with the strengthening of the EAC perhaps playing some role, although, this can’t be confirmed at this stage.

Similarly, total abundance showed a strong latitudinal trend in most seasons, with higher larval abundances in the north, although summer again was the only exception (Figure 4). In summer, there was little change in abundance down the east coast. Again, this is due to local spawning driving the increase in abundance in the higher latitudes, reflecting the strong seasonal character in fish spawning for this region.

Based on the first Principal Coordinate Analysis, the fish larval community has varied over time down the east coast of Australia (Figure 5). Before 1998, there is a marked difference in Principal Coordinate Analysis scores between northern and southern Australia. By contrast, after 1998, the Principal Coordinate Analysis scores varied less with latitude. Thus, the larval fish assemblage south of 35°S appears  more similar to the northern assemblages post-1998. This might suggest that post-1998 fish larval assemblages at southern latitudes became more similar to the northern assemblages compared to those before 1998, an expected outcome under a warming climate.  However, at this point in time, data from Tasmanian waters after the 1998 El Nino benchmark event is limited. Therefore, these trend needs further investigation, and the continuation of IMOS larval fish observations is crucial to ascertain if this trend is real.

Here we show that the abundance and diversity of fish larvae decline towards the south of the east Australian coast. Furthermore, we found that the EAC may be playing an important role in what appears to be a weakening of the latitudinal gradient of the larval fish assemblage post-1998. This trend, is in agreement with the gradients found in copepod communities along the east coast of Australia, with warm-water communities being distributed further down the east coast during summer (see State and Trends of Australia’s Ocean Report 4.3: Use of zooplankton communities to estimate the relative strength of the East Australian Current). Collectively, these findings highlight the strong structuring role that the EAC is having on pelagic communities down the east coast of Australia.

The behaviour of the EAC also explains the long-term changes in the distribution of fish larvae in response to climate change we observed. The increase in the strength of the EAC has driven a poleward shift in species distribution, which is superimposed on local warming, promoting the transport of warmer-water fish species further south (Booth et al., 2011, Booth et al., 2007, Ridgway, 2007, Johnson et al., 2011, Last et al., 2011). This explains why we observe more similar communities of fish larvae down the east coast after 1998 compared with years beforehand.

The shift in the distribution of marine organisms is one of the main expected impacts of climate change and can have ecological and economic consequences (Pecl et al., 2017, Booth et al., 2011, Last et al., 2011).. Ecologically, the movement of species causes the reshuffling of existing communities (Booth et al., 2011, Vergés et al., 2016). The southward shift in fish larval distributions may suggest that spawning regions are shifting as the ocean warms due to climate change – and although probably thermally suitable, the impacts on recruitment are unclear. Thus, this shift in the distribution of fish larvae could have an economic effect, with some commercial species shifting away from current fishing areas while presenting new opportunities in new regions.

The IMOS larval fish monitoring program fills a unique gap in Australian marine science. It is the only monthly fisheries-independent dataset for understanding the spawning of fish that are of commercial and non-commercial importance. As the time series grows, the IMOS larval fish monitoring program will provide new insights into not only how fish larval assemblages are changing their distribution with climate change, but also how the timing of spawning might be impacted.

Booth, D. J., Bond, N., & Macreadie, P. (2011). Detecting range shifts among Australian fishes in response to climate change. Marine and Freshwater Research, 62(9), 1027-1042.

Booth, D. J., Figueira, W. F., Gregson, M. A., Brown, L., & Beretta, G. (2007). Occurrence of tropical fishes in temperate southeastern Australia: Role of the East Australian Current. Estuarine, Coastal and Shelf Science, 72(1-2), 102-114. Retrieved from http://www.sciencedirect.com/science/article/B6WDV-4MFKDD0-1/2/e36241f1aac00e308e22cc27586632c8

Chaudhary, C., Saeedi, H., & Costello, M. J. (2017). Marine species richness is bimodal with latitude: A reply to Fernandez and Marques. Trends in Ecology & Evolution, 32, 234-237.

Cowen, R. K., Gawarkiewicz, G., Pineda, J., Thorrold, S. R., & Werner, F. E. (2007). Population connectivity in marine systems an overview. Oceanography, 20(3), 14-21.

Hsieh, C.-h., Reiss, C. S., Hunter, J. R., Beddington, J. R., May, R. M., & Sugihara, G. (2006). Fishing elevates variability in the abundance of exploited species. Nature, 443(7113), 859.

Johnson, C. R., Banks, S. C., Barrett, N. S., Cazassus, F., Dunstan, P. K., Edgar, G. J., . . . Taw, N. (2011). Climate change cascades: Shifts in oceanography, species' ranges and subtidal marine community dynamics in eastern Tasmania. Journal of Experimental Marine Biology and Ecology, 400(1-2), 17-32. doi:10.1016/j.jembe.2011.02.032

Keane, J. P., & Neira, F. J. (2008). Larval fish assemblages along the south‐eastern Australian shelf: linking mesoscale non‐depth‐discriminate structure and water masses. Fisheries Oceanography, 17(4), 263-280.

Koslow, J. A., & Couture, J. (2013). Ocean sciences: Follow the fish. Nature News, 502(7470), 163.

Koslow, J. A., & Wright, M. (2016). Ocean sciences: Follow the fish. Nature News, 502, 163.

Last, P. R., White, W. T., Gledhill, D. C., Hobday, A. J., Brown, R., Edgar, G. J., & Pecl, G. (2011). Long-term shifts in abundance and distribution of a temperate fish fauna: a response to climate change and fishing practices. Global Ecology and Biogeography, 20(1), 58-72. doi:10.1111/j.1466-8238.2010.00575.x

Leis, J., & McGrouther, M. (1996). Regional larval fish archives now in operation: availability of an important fisheries resource. Australian Society for Fish Biology, Inc. Newsletter, 26, 25-31.

Pecl, G. T., Araujo, M. B., Bell, J. D., Blanchard, J., Bonebrake, T. C., Chen, I. C., . . . Williams, S. E. (2017). Biodiversity redistribution under climate change: Impacts on ecosystems and human well-being. Science, 355(6332), 9. doi:10.1126/science.aai9214

Ridgway, K., Coleman, R., Bailey, R., & Sutton, P. (2008). Decadal variability of East Australian Current transport inferred from repeated high-density XBT transects, a CTD survey and satellite altimetry. Journal of Geophysical Research, 113, 18pp.

Ridgway, K. R. (2007). Long-term trend and decadal variability of the southward penetration of the East Australian Current. Geophysical Research Letters, 34(13), 1-5. doi:L1361310.1029/2007gl030393

Smith, J. A., Miskiewicz, A. G., Beckley, L. E., Everett, J. D., Garcia, V., Gray, C. A., . . . Lara-Lopez, A. (2018). A database of marine larval fish assemblages in Australian temperate and subtropical waters. Scientific data, 5, 180207.

Vergés, A., Doropoulos, C., Malcolm, H. A., Skye, M., Garcia-Pizá, M., Marzinelli, E. M., . . . Vila-Concejo, A. (2016). Long-term empirical evidence of ocean warming leading to tropicalization of fish communities, increased herbivory, and loss of kelp. Proceedings of the National Academy of Sciences, 113(48), 13791-13796.

Figure 1

Locations of data for each Survey and the IMOS National Reference Stations (IMOS NRS) at which monthly sampling of larval fishes is ongoing are indicated.

Figure 2

Density of larval fish (ind. m-3) around Australia from historical datasets and IMOS NRS stations in Maria Island, Port Hacking and Stradbroke Island.

Figure 3

Seasonal effect of latitude on larval fish species richness in relation to the mean, after accounting for the effects of bathymetry, sampling depth, gear type (data not shown). The solid line represents the regression spline fitted in a GAM with 95% confidence intervals for the mean fit.

Figure 4

Effect of latitude on larval fish abundance in relation to the mean, after accounting for the effects of bathymetry, sampling depth, gear type. Data were grouped into terrestrial seasons. The solid line represents the regression spline fitted in a GAM with 95% confidence intervals for the mean fit.

Figure 5

PCO1 loadings from each sample plotted against latitude. The red line is fitted using loess smoother for the post-1998 data with 95% confidence intervals, and the black line is loess smoother for the pre-1998 data with 95% confidence intervals.

Download this Time Series Report

Citing this report: 

Lara-Lopez A, Hichliffe C, Suthers I.M, Richardson A.J, Matis P.A. (2020). Temporal and spatial changes in larval fish. In Richardson A.J, Eriksen R, Moltmann T, Hodgson-Johnston I, Wallis J.R. (Eds). State and Trends of Australia’s Ocean Report. doi: 10.26198/5e16b12149e8b

doi: 10.26198/5e16b12149e8b

Access the Data

Access the data that contributes to this time-series by clicking the icons below

02. SOOP-02

Ships of Opportunity

06f. National Reference stations-02

National Reference Stations

Citing the Report

Richardson A.J, Eriksen R, Moltmann T, Hodgson-Johnston I, Wallis J.R. (2020). State and Trends of Australia’s Ocean Report, Integrated Marine Observing System (IMOS).

IMOS_logo-stacked-reversed-01

The State and Trends of Australia's Ocean Report was supported by IMOS. IMOS gratefully acknowledges the additional support provided by the Commonwealth Scientific and Industrial Research Organisation (CSIRO).

The State and Trends of Australia's Ocean website is maintained by IMOS.


NCRIS-PROVIDER-REV

Australia’s Integrated Marine Observing System (IMOS) is enabled by the National Collaborative Research Infrastructure Strategy (NCRIS). It is operated by a consortium of institutions as an unincorporated joint venture, with the University of Tasmania as Lead Agent.

Disclaimer:

You accept all risks and responsibility for losses, damages, costs and other consequences resulting directly or indirectly from using this site and any information or material available from it. While the Integrated Marine Observing System (IMOS) has taken reasonable steps to ensure that the information on this website and related publication is correct, it provides no warranty or guarantee that information provided by the authors is accurate, complete or up-to-date. IMOS does not accept any responsibility or liability for any actions taken as a result of, or in reliance on, information on its website or publication. Users should check with the originating authors to confirm the accuracy of the information before taking any action in reliance on that information.

If you believe any information on this website or in the related publication is inaccurate, out of date or misleading, please bring it to our attention by contacting the authors directly or emailing us at IMOS@imos.org.au


Images and Information:

All information on this website remains the property of those who authored it. All images on this website are licensed through Adobe Stock, Shutterstock, or have permission from the original owner.