Physical and Chemical

1.1

Long-term changes in temperature around Australia

Contributors

Anthony J. Richardson 1,2

Charitha B. Pattiaratchi 3,4

1 CSIRO Oceans and Atmosphere, Queensland Biosciences Precinct (QBP), St Lucia, QLD, Australia
2 Centre for Applications in Natural Resource Mathematics (CARM), School of Mathematics and Physics, The University of Queensland, St Lucia, QLD, Australia
3 Oceans Graduate School, The University of Western Australia, Perth, WA, Australia
4 UWA Oceans Institute, The University of Western Australia, Perth, WA, Australia

Key Information

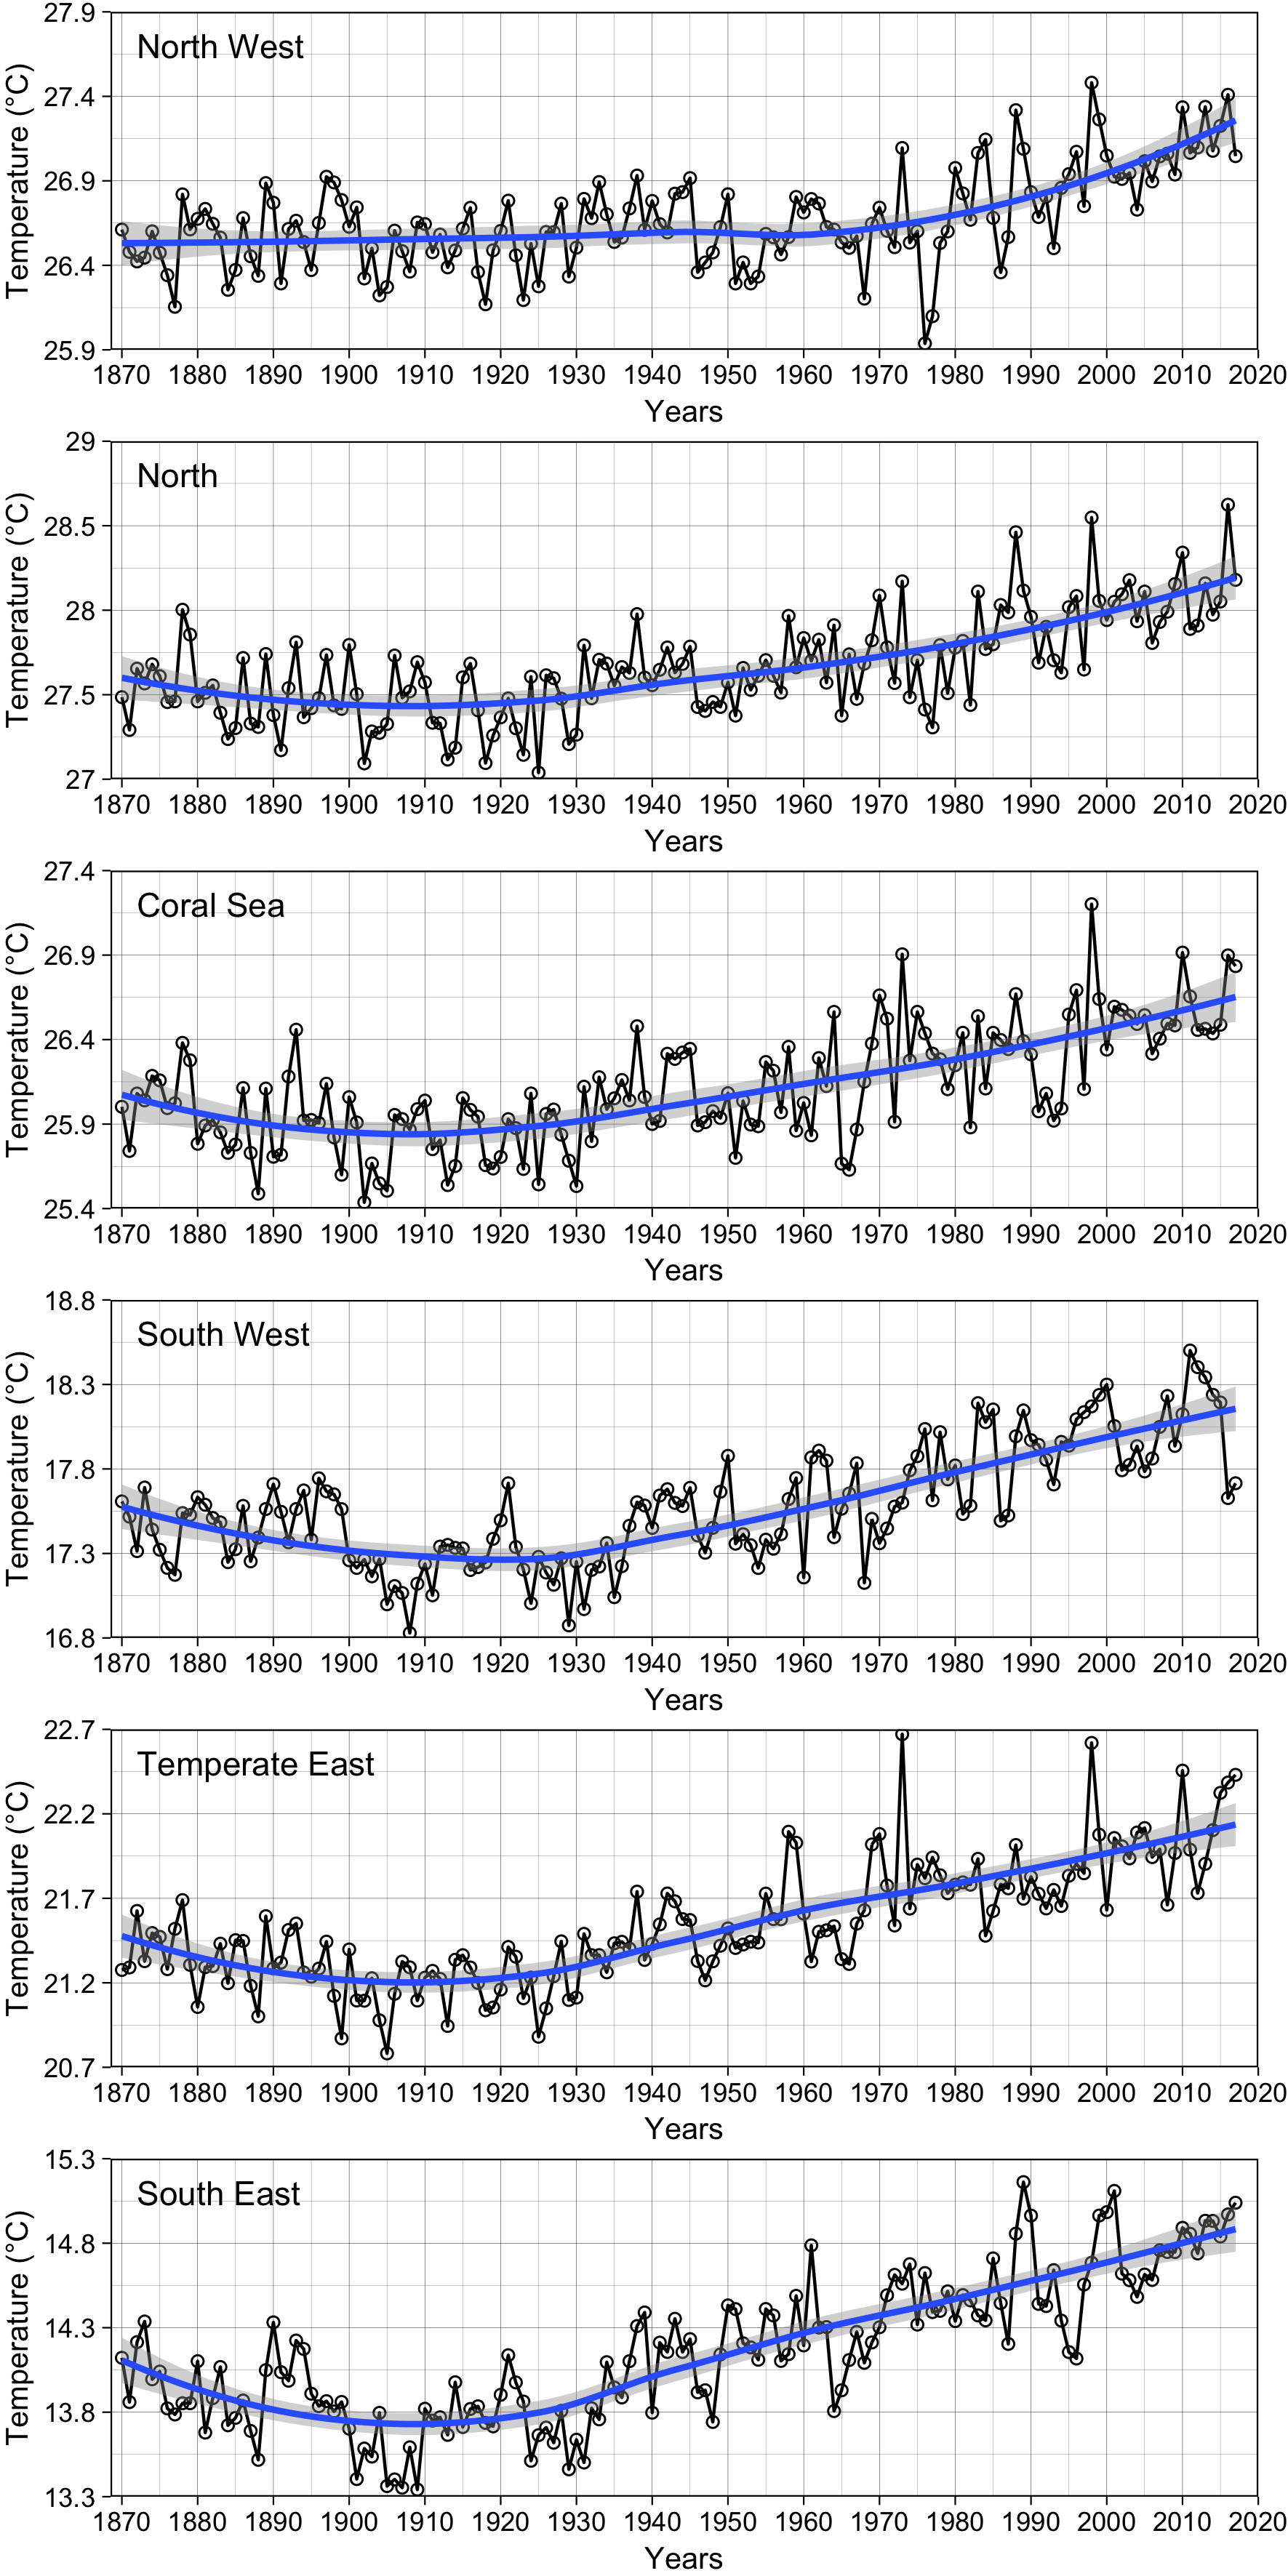
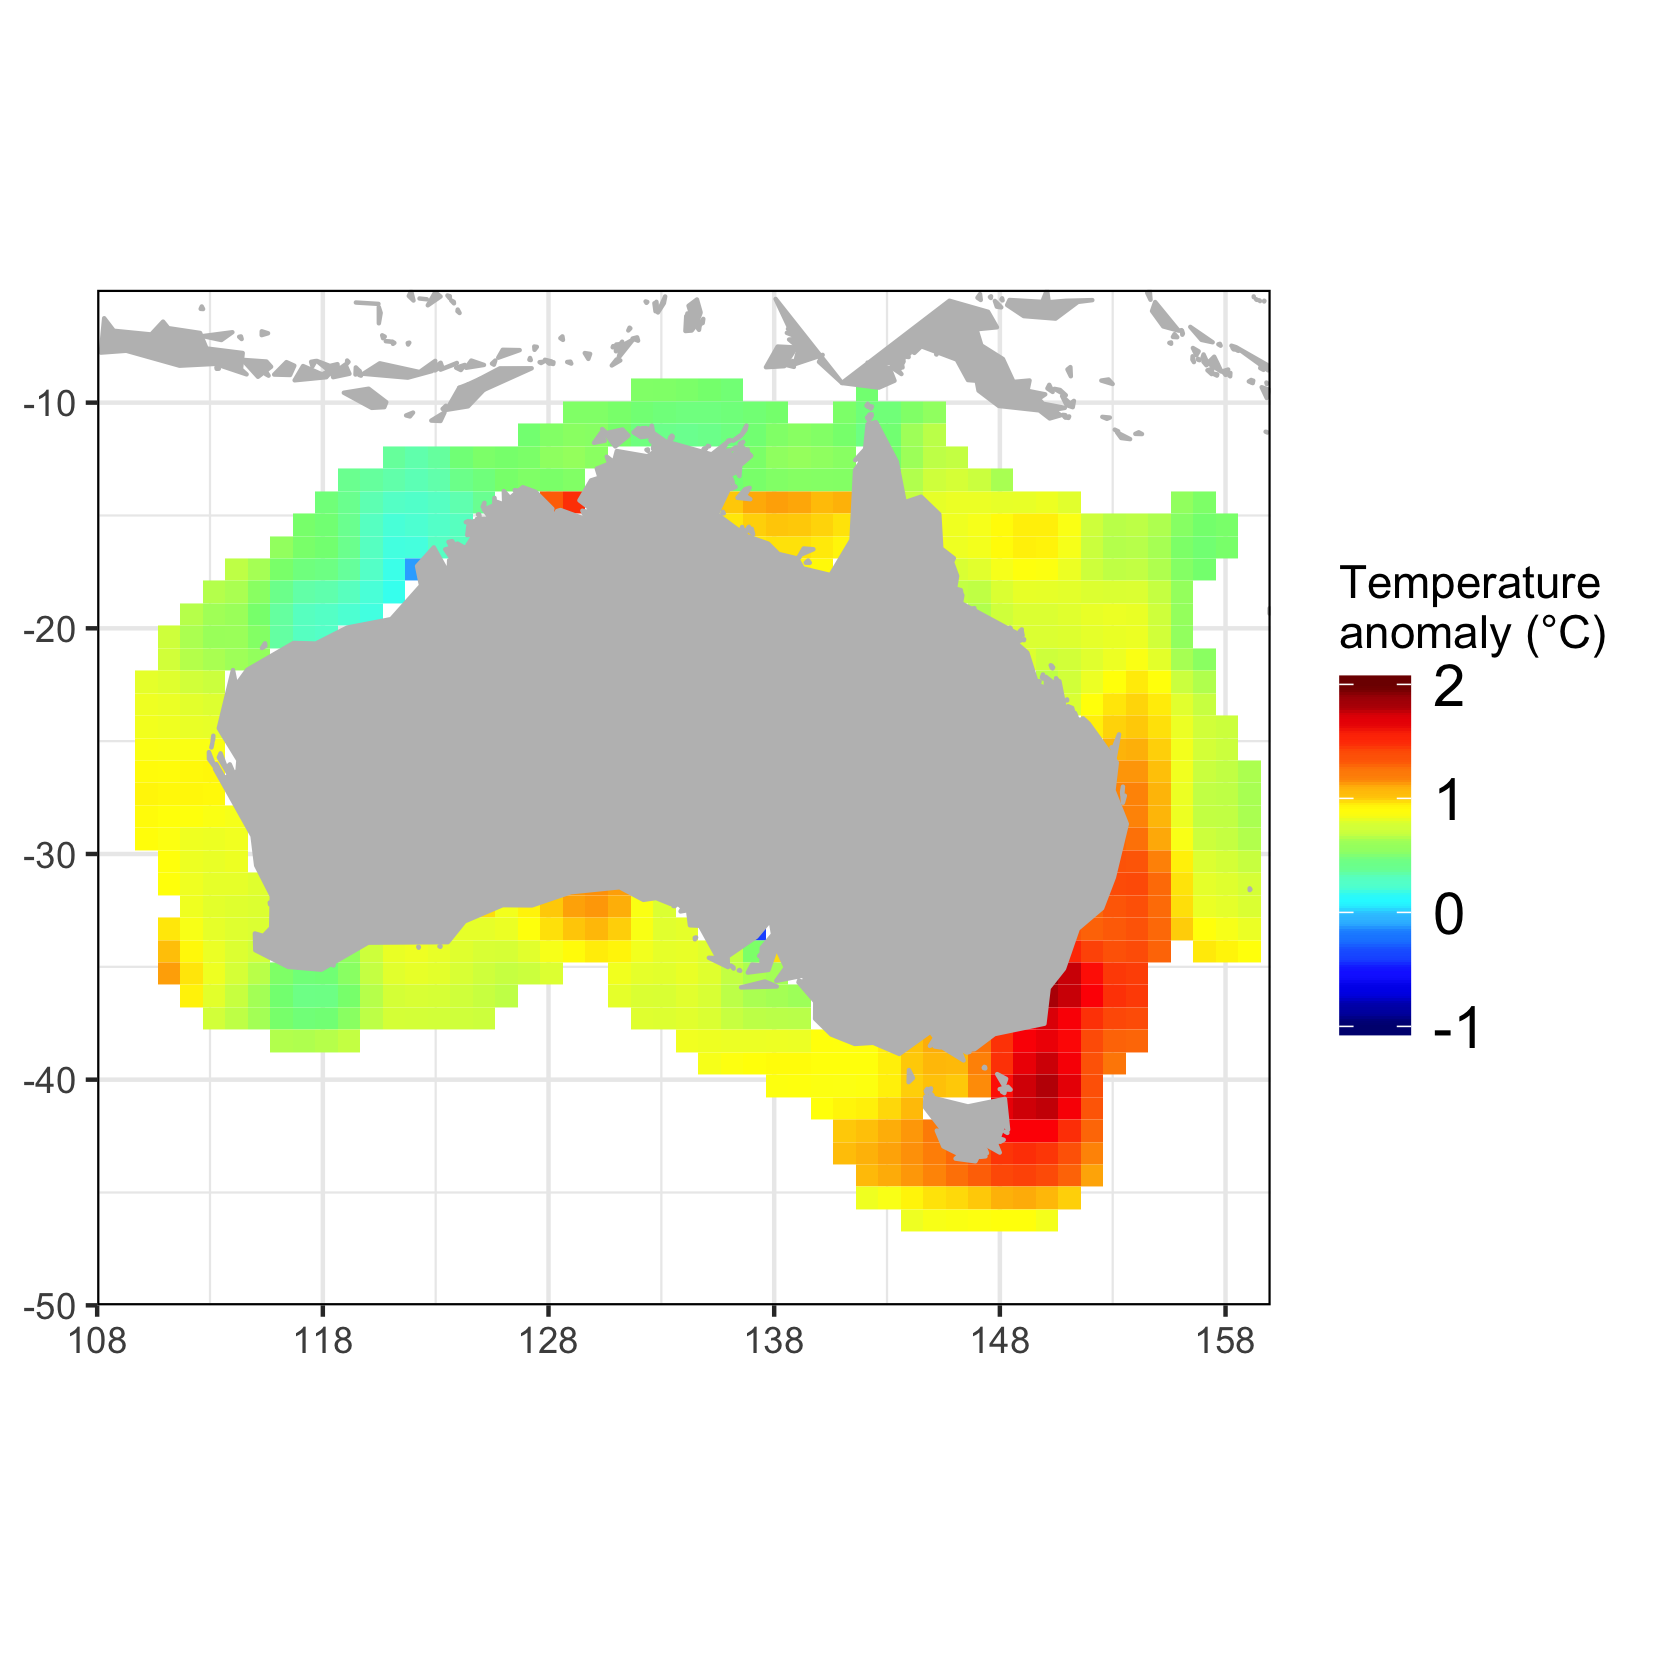
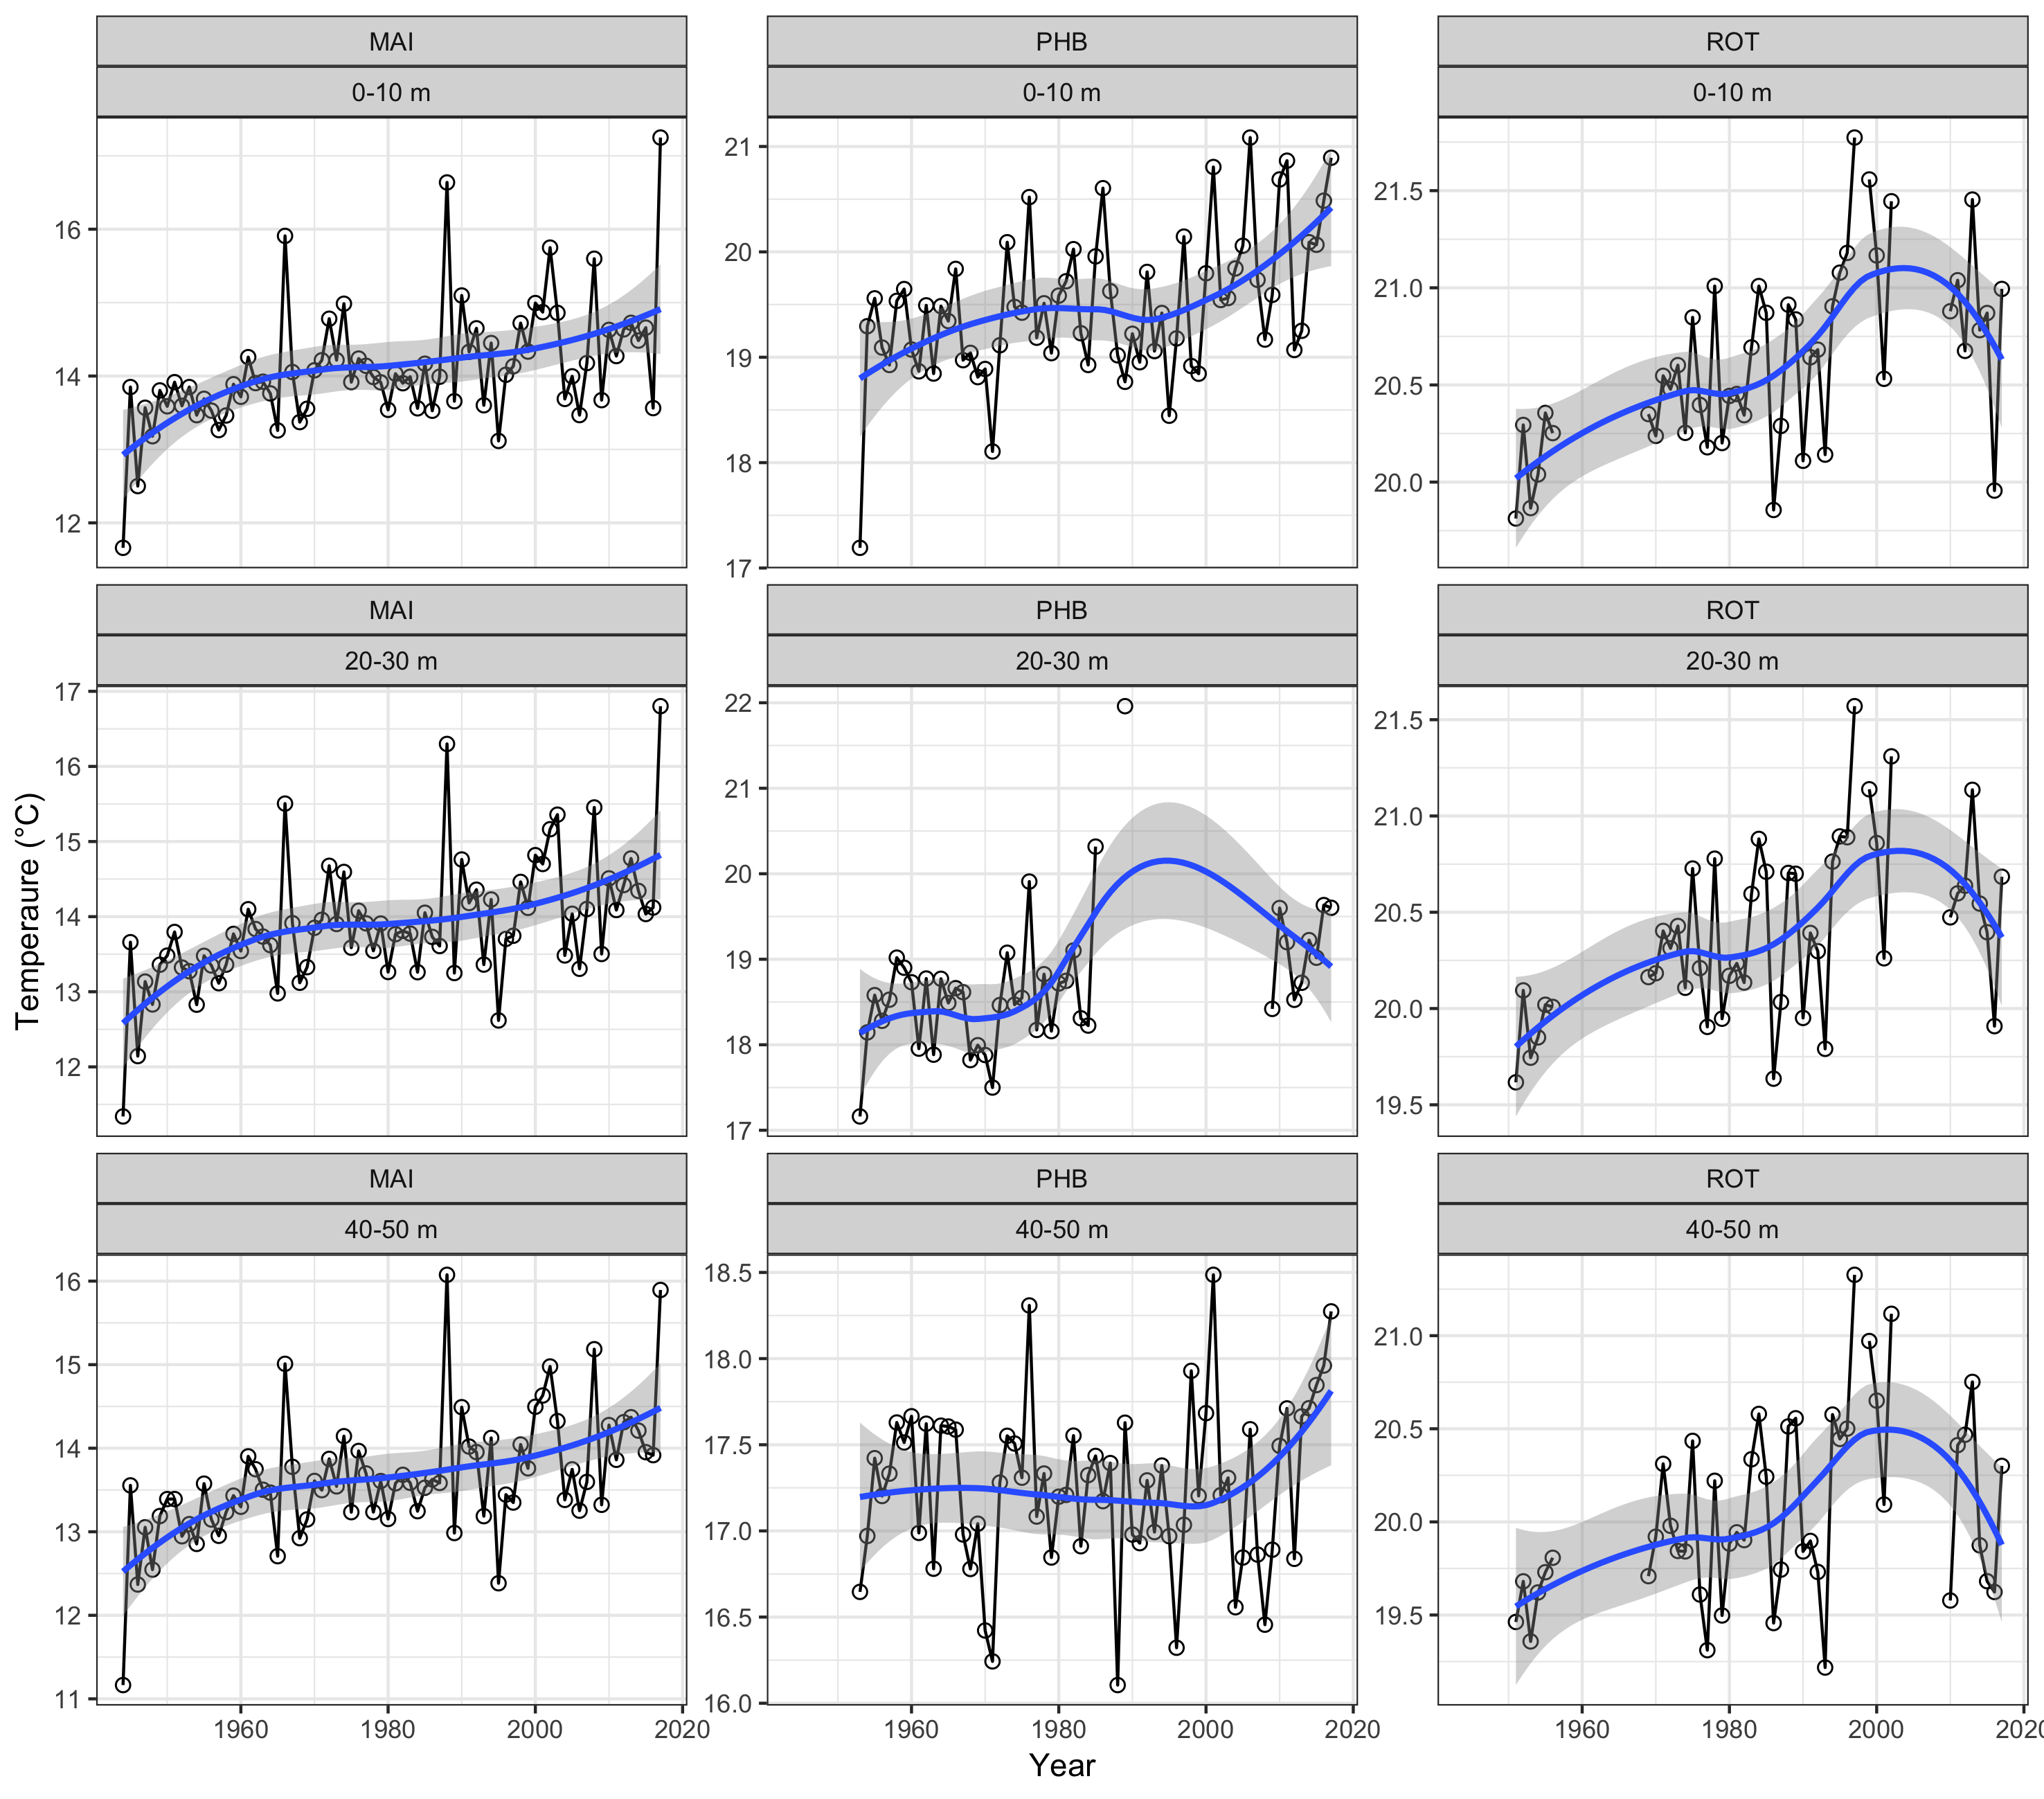
Coarse long-term temperature data around Australia from 1870 and fine-scale temperature measurements from the three long-term stations since the 1940s confirm a strong warming trend over the past 100 years, with the strongest warming in the Southeast and the Southwest. This background warming signal is propagating throughout the ecosystem, impacting the physical, chemical and biological characteristics of Australia’s marine environment.

Keywords

warming, long-term stations, East Australian Current, HadISST

Long-term changes in temperature around Australia

The clearest impact of climate change impacts on the ocean is warming, particularly of surface layers that are in closest contact with the atmosphere. Temperature is of fundamental importance to the physics of the ocean. It describes the heat content of the ocean, affects the density and buoyancy of water, and helps distinguish water masses.

Temperature also drives the biology in the ocean. As warming reduces the density of water, and thus enhances stratification, it can lead to lower nutrient concentrations in surface waters, particularly in subtropical and tropical waters. This reduces primary productivity and diminishes phytoplankton and zooplankton biomass. This can then reduce fish biomass in the ocean (Irigoien et al., 2014; Richardson & Schoeman, 2004), especially under climate change (e.g. Galbraith, Carozza, & Bianchi, 2017). Temperature also drives changes in the distribution of marine plants and animals, with most species moving towards cooler temperatures at higher latitudes (Poloczanska et al., 2013). The pace of life in the ocean is also governed by temperature, through its impact on photosynthesis and metabolic rates.

To investigate long-term changes in sea surface temperature (SST) around Australia, we have used two different datasets. The longest time-scale is from 1870-2018, we used HadISST1, a monthly 1° global product, which is a blend of in situ and satellite temperature measurements  (Rayner et al., 2003, available from https://www.metoffice.gov.uk/hadobs/hadisst/). We averaged HadISST1 in the six marine bioregions within the Australian EEZ. We also calculated the difference in SST between the present and the past from HadISST data using a linear regression over the entire time series and taking the difference between the estimated temperature in 2017 and that in 1870.

From 1944-2018, we used the longest observed temperature time series in Australia. This is from the three long-term National Reference Stations: Port Hacking, Maria Island and Rottnest Island (AODN dataset: “IMOS - ANMN National Reference Stations - Combined long-term hydrological data product (1944-2014)”).

In Australia’s marine bioregions, there was a slight cooling or no change in temperature between 1870 and the early 1900s (Figure 1). Since 1920, there has been steady warming, particularly in the south. The greatest warming has been in the South-east (1.1°C century-1), the South-west (0.99°C century-1) and the Temperate East (0.93°C century-1) bioregions, with less warming in the North-west (0.6°C century-1), North (0.74°C century-1) and Coral Sea (0.8°C century-1). The general spatial pattern shows that there has been warming throughout all of Australia since 1870, particularly in the South-east (Figure 2).

Data from the long-term National Reference Stations in Australia confirm the surface warming from HadISST1 data, showing strong warming over the past 80 years over all depths in the top 50 m. At Maria Island, all depths show a near-linear increase in temperature, up to ~2°C. Since the 1950s at Port Hacking there has been less warming, ~1.5°C. At Rottnest Island there has been moderate warming of ~0.75°C, including some more recent cooling.

The HadISST1 data and temperature measurements from the three long-term stations confirm a strong warming trend in Australian waters over the past 150 years. The strength of the warming varies regionally. It is partly a consequence of global warming, amplified by changes of the regional ocean circulation (Ridgway, 2007). The South-east and Temperate East bioregions are warming the fastest because of changes to the path of the East Australian Current, causing increased warm-water incursions into Tasmanian waters (Hill, Rintoul, Coleman, & Ridgway, 2008). 

This rapid warming has important implications for the distribution of marine organisms, permitting tropical and subtropical species to survive further south (Johnson et al., 2011; Last et al., 2011). However, resident cold-water coastal species in southern Australia are limited in the extent they can move further south before running out of habitat.

Cai, W., Shi, G., Cowan, T., Bi, D., & Ribbe, J. (2005). The response of the Southern Annular Mode, the East Australian Current, and the southern mid-latitude ocean circulation to global warming. Geophysical Research Letters, 32(23). doi:L2370610.1029/2005gl024701

Galbraith, E. D., Carozza, D. A., & Bianchi, D. (2017). A coupled human-earth model perspective on long-term trends in the global marine fishery. Nature Communications, 8, 7. doi:10.1038/ncomms14884

Hill, K. L., Rintoul, S. R., Coleman, R., & Ridgway, K. R. (2008). Wind forced low frequency variability of the East Australia Current. Geophysical Research Letters, 35(8). doi:10.1029/2007gl032912

Irigoien, X., Klevjer, T. A., Rostad, A., Martinez, U., Boyra, G., Acuna, J. L., . . . Kaartvedt, S. (2014). Large mesopelagic fishes biomass and trophic efficiency in the open ocean. Nature Communications, 5, 10. doi:10.1038/ncomms4271

Johnson, C. R., Banks, S. C., Barrett, N. S., Cazassus, F., Dunstan, P. K., Edgar, G. J., . . . Taw, N. (2011). Climate change cascades: Shifts in oceanography, species' ranges and subtidal marine community dynamics in eastern Tasmania. Journal of Experimental Marine Biology and Ecology, 400(1-2), 17-32. doi:10.1016/j.jembe.2011.02.032

Last, P. R., White, W. T., Gledhill, D. C., Hobday, A. J., Brown, R., Edgar, G. J., & Pecl, G. (2011). Long-term shifts in abundance and distribution of a temperate fish fauna: a response to climate change and fishing practices. Global Ecology and Biogeography, 20(1), 58-72. doi:10.1111/j.1466-8238.2010.00575.x

Poloczanska, E. S., Brown, C. J., Sydeman, W. J., Kiessling, W., Schoeman, D. S., Moore, P. J., . . . Richardson, A. J. (2013). Global imprint of climate change on marine life. Nature Climate Change, 3, 919. doi:10.1038/nclimate1958 https://www.nature.com/articles/nclimate1958#supplementary-information

Rayner, N. A., Parker, D. E., Horton, E. B., Folland, C. K., Alexander, L. V., Rowell, D. P., . . . Kaplan, A. (2003). Global analyses of sea surface temperature, sea ice, and night marine  air temperature since the late nineteenth century. Journal of Geophysical Research, 108.

Richardson, A. J., & Schoeman, D. S. (2004). Climate impact on plankton ecosystems in the northeast Atlantic. Science, 305(5690), 1609-1612. doi:10.1126/science.1100958

Ridgway, K. R. (2007). Long-term trend and decadal variability of the southward penetration of the East Australian Current. Geophysical Research Letters, 34(13), 1-5. doi:L1361310.1029/2007gl030393

Figure 1

Long-term (since 1870) temperatures (°C) from HadISST in each marine bioregion. Note the different y-axis scales. A loess smoother was included to highlight the long-term pattern.

Figure 2

Difference in sea surface temperature between 2017 and 1870, based on a linear trend over the time series.

Figure 3

Long-term mean annual temperatures (°C) from Maria Island, Port Hacking and Rottnest Island reference stations in three depth strata in the top 50 m (n=4,500). Note the different y-axis scales. A loess smoother was included to highlight the long-term pattern.

Download this Time Series Report

Citing this report: 

Richardson A.J, Pattiaratchi C.B. (2020) Long-term change sin temperature around Australia. In Richardson A.J, Eriksen R, Moltmann T, Hodgson-Johnston I, Wallis J.R. (Eds). State and Trends of Australia’s Ocean Report. doi: 10.26198/5e169fa949e73

doi: 10.26198/5e169fa949e73

Access the Data

Access the data that contributes to this time-series by clicking the icons below

11. SRS-02

Satellite Remote Sensing

06f. National Reference stations-02

National Reference Stations

Citing the Report

Richardson A.J, Eriksen R, Moltmann T, Hodgson-Johnston I, Wallis J.R. (2020). State and Trends of Australia’s Ocean Report, Integrated Marine Observing System (IMOS).

IMOS_logo-stacked-reversed-01

The State and Trends of Australia's Ocean Report was supported by IMOS. IMOS gratefully acknowledges the additional support provided by the Commonwealth Scientific and Industrial Research Organisation (CSIRO).

The State and Trends of Australia's Ocean website is maintained by IMOS.


NCRIS-PROVIDER-REV

Australia’s Integrated Marine Observing System (IMOS) is enabled by the National Collaborative Research Infrastructure Strategy (NCRIS). It is operated by a consortium of institutions as an unincorporated joint venture, with the University of Tasmania as Lead Agent.

Disclaimer:

You accept all risks and responsibility for losses, damages, costs and other consequences resulting directly or indirectly from using this site and any information or material available from it. While the Integrated Marine Observing System (IMOS) has taken reasonable steps to ensure that the information on this website and related publication is correct, it provides no warranty or guarantee that information provided by the authors is accurate, complete or up-to-date. IMOS does not accept any responsibility or liability for any actions taken as a result of, or in reliance on, information on its website or publication. Users should check with the originating authors to confirm the accuracy of the information before taking any action in reliance on that information.

If you believe any information on this website or in the related publication is inaccurate, out of date or misleading, please bring it to our attention by contacting the authors directly or emailing us at IMOS@imos.org.au


Images and Information:

All information on this website remains the property of those who authored it. All images on this website are licensed through Adobe Stock, Shutterstock, or have permission from the original owner.