Biological Time Series - Water quality

3.1

Water clarity around Australia-satellite and in-situ observations

Contributors

Peter Thompson1

Karlie McDonald1

1 CSIRO Oceans and Atmosphere, Hobart, TAS, Australia

Key Information

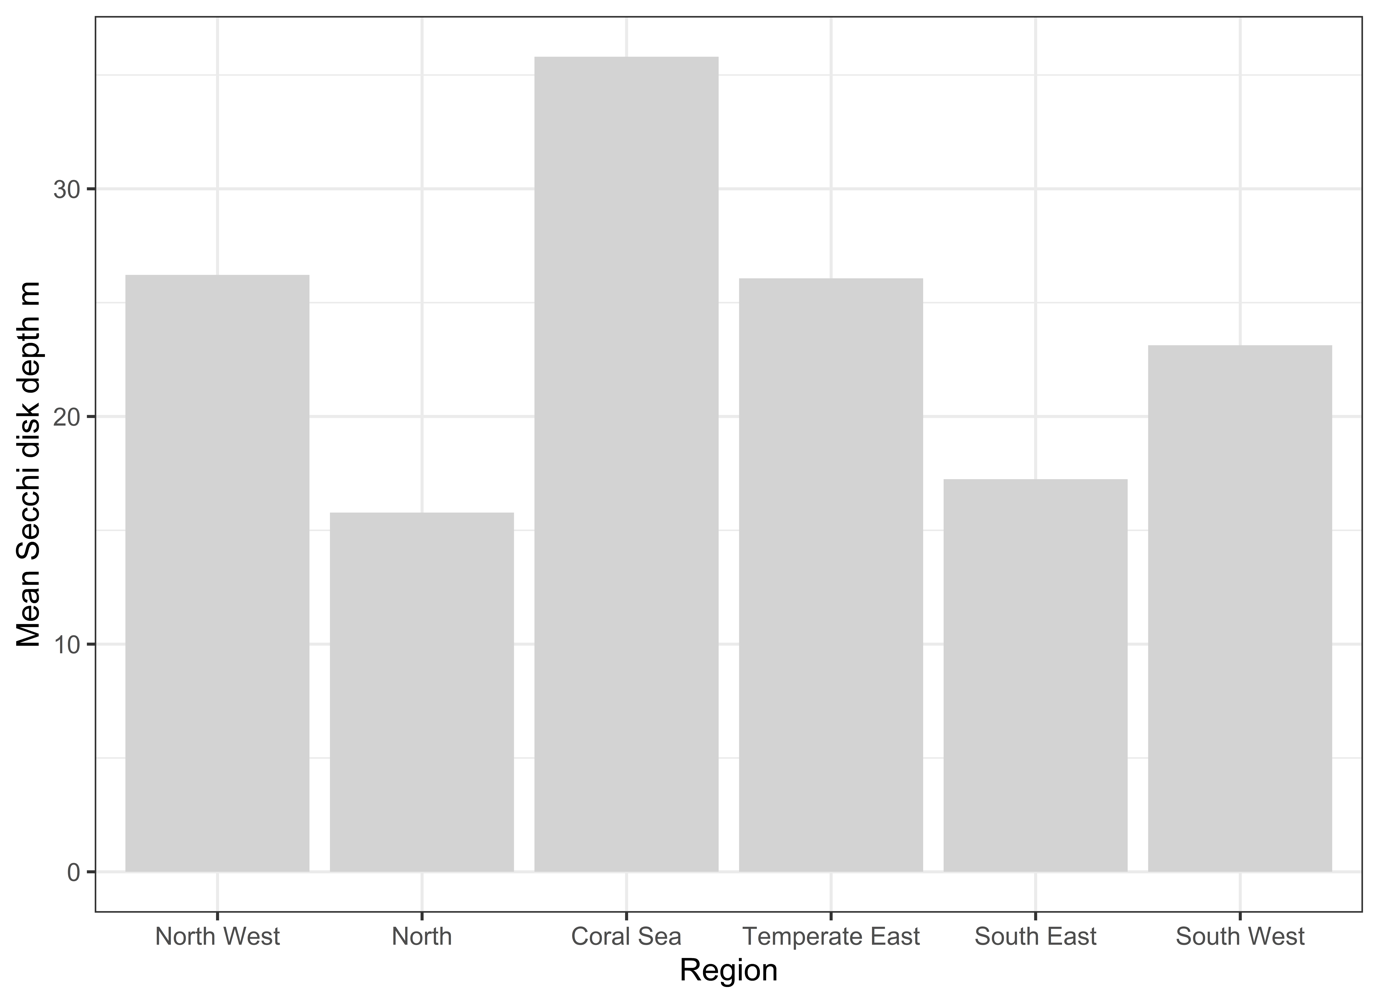
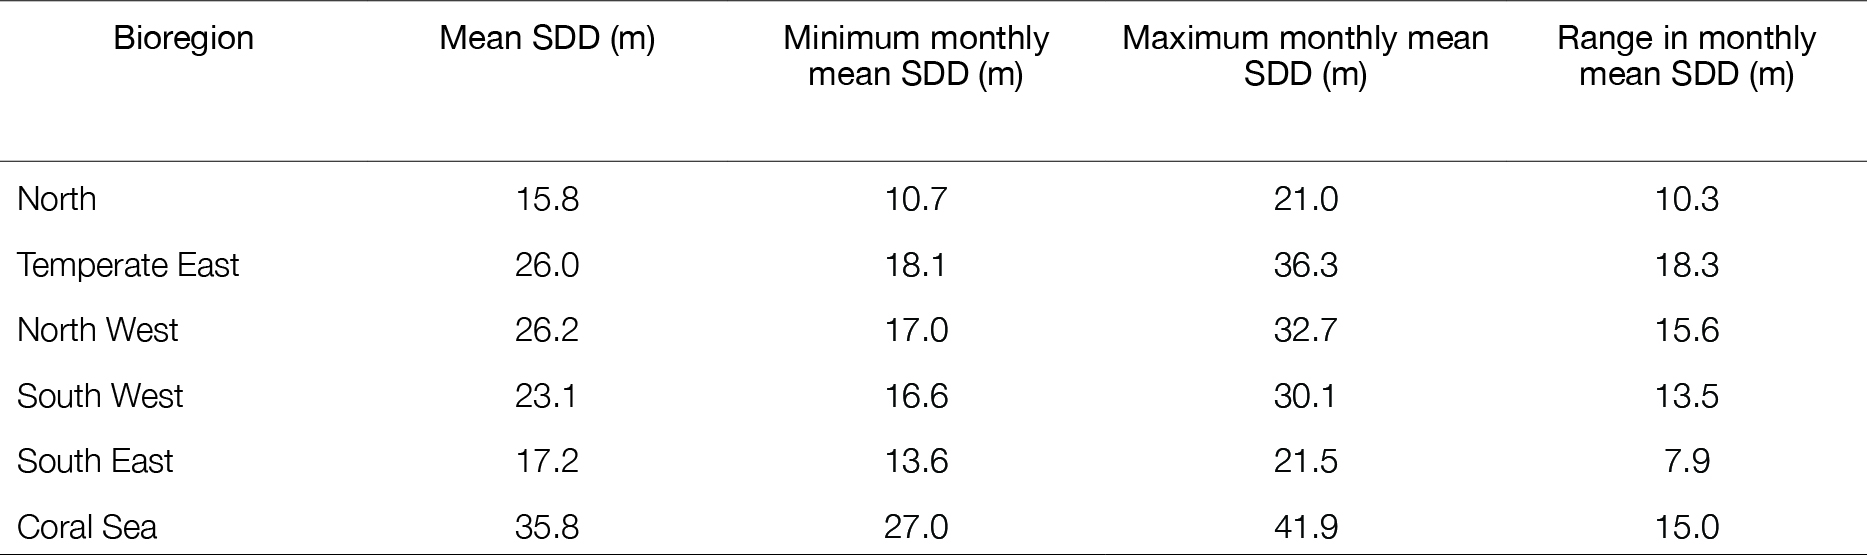
Water clarity, an indicator of water quality is highest offshore and lowest in coastal waters due to sediments and phytoplankton biomass. Northern areas typically have the lowest water clarity due to tidal re-suspension of sediments and high seasonal runoff.

Keywords

water quality, secchi disk, water transparency

Water clarity around Australia-satellite and in-situ observations

Water clarity is a fundamental measure of water quality used to help protect our marine environment. There are many ways it can be measured and reported. One of the best is to measure the reduction in light with depth over many metres (Lee et al., 2015). This integrating method improves the scientific value of the measurement so that we can better understand the state and trends in water quality. Although old technology, the Secchi Disk is an excellent tool for this type of observation (Hou, Lee, & Weidemann, 2007; Preisendorfer, 1986). Generally, Australian marine waters are low in turbidity, low in colour and high in transparency. Much of our flora and fauna are adapted to these conditions and a deterioration in transparency puts these communities and populations at increased risk of stress and impaired conditions. In oceanic and outer continental shelf waters, the major determinants of turbidity, transparency and colour is the biomass of phytoplankton (Yentsch, 1960). Most waters off Australian shores are low in phytoplankton and we thus have some of the clearest waters on the planet. Light penetrates deeply, allowing phytoplankton to grow down to >100 m. Nearshore regions of the continental shelf often have benthic communities dominated by coral or aquatic plants (e.g. seagrasses and macrophytes) that are dependent upon sunlight reaching the bottom.

The Secchi Disk method was invented in the 1800s by P.A. Secchi (first published in ‘Relazione delle esperienze fatte a bordo della pontificia pirocorvetta l’Immacolata concezione per determinare la trasparenza del mare; Memoria del P. A. Secchi’ in Il Nuovo Cimento December 1864, Volume 20, Issue 1, pp 205–238). It has a long history of use by many institutions and the length of time means it is a valuable measure of change in water transparency over long periods (Wernand, 2010). The technique involves lowering a plain white (or black and white) circular disk 30 cm in diameter on a line. The depth at which the disk is no longer visible is known as the Secchi depth and is a measure of the transparency of the water column or turbidity.

With a modest amount of training, the easy-to-use Secchi disk can provide accurate data and has been adopted in citizen science programs (for example, see http://www.secchidisk.org/). It has been applied in many scientific studies of phytoplankton productivity (Falkowski & Wilson, 1992). Because of the value of Secchi disk data, modern satellites have an algorithm to estimate Secchi depth, which is comparable to in situ measurements. The advantage of satellites is that they provide an excellent global picture of water clarity by scanning all oceans every 3 days. Here we have used Secchi Disk Depth data from NASA’s MODerate resolution Imaging Spectroradiometer (MODIS) satellite estimated using the algorithm of Morel et al. (2007).  

Here we analyse the Secchi disk depth on three different scales: a regional scale (10-50°S and 100-170°E), Australia’s six bioregions (see Common Methods), and the Integrated Marine Observing System (IMOS) National Reference Stations (https://portal.aodn.org.au/; see the dataset “IMOS National Reference Station (NRS) - Total Suspended Solids (TSS) and Secchi Depth”).

Trends across the region

On a regional scale around Australia, water transparency declines strongly toward shore (Figure 1) due to increased sediment and greater phytoplankton biomass. Areas of greatest water clarity are offshore in the Indian and Pacific Oceans. Tropical rivers in areas of high rainfall also supply large amounts of sediment to the coastal zone, increasing turbidity especially in northern seas between Australia and Indonesia (Figure 1). These turbid waters can have strong seasonality, with the turbidity increasing by up to 3 orders of magnitude during the tropical monsoon season and can cover extensive areas in our tropical seas. During tropical cyclones, both runoff and bottom disturbance by waves can also generate substantial turbidity in shallow areas such as the Gulf of Carpentaria. Waves also contribute to turbidity, and shallow water bodies with a large fetch are more turbid than deeper water bodies or those with lower wind speed or fetch. Areas with large tides (e.g. NW coast) or tidally flushed creeks can also have high turbidity and shallow Secchi depth.

Water clarity within the Australian EEZ

Within Australia’s continental EEZ, the average Secchi disk depth was 24 m. Water clarity was best and the depth greatest in the NE, particularly the Coral Sea. Secchi depth was generally much lower nearshore, low in the Gulf of Carpentaria, and low through Bass Strait and around Tasmania (Figure 3). The temporal pattern of Secchi depth in the EEZ was similar to the broader region. Over the entire EEZ, Secchi depth was similar to that within the Australian region but minimum seasonal values were lower, possibly reflecting the reduction in the relative amount of open ocean. While seasonal variation was also high in the EEZ, there was no long-term trend detected (Figure 4).  

Water clarity in Australia’s six bioregions

All six bioregions around the coast of Australia were significantly different from each other in terms of their mean water clarity (P<0.01), except the Temperate East (mean Secchi depth = 26 m) and North West bioregions (mean = 26.2 m, Figure 5, Table 1). The North bioregion had the lowest Secchi depth – i.e. the lowest water transparency and the most opaque waters. The Coral Sea had the clearest waters, followed by the North West and Temperate East (Table 1). All bioregions showed some seasonal variability in Secchi depth, with largest seasonal changes in the Temperate East, North West and Coral Sea (Figure 6). The North and the South East bioregions had the lowest Secchi depth and the least seasonality (Table 1). There were no significant long-term trends in Secchi depth from 2002 to 2019 in any bioregion (Figure 7). 

The IMOS National Reference Stations (NRS)

From the IMOS NRS stations around Australia, Darwin had the lowest Secchi depth and North Stradbroke Island had the greatest (Figure 8), a pattern broadly reflecting satellite observations and providing much needed validation of patterns detected by satellites.

In this study there were significant spatial differences in water clarity around Australia with northern areas having low Secchi depths in association with tidal resuspension of sediments and high seasonal runoff.  Seasonal differences in Secchi depth tended to be greatest in the Temperate East, North West and Coral Sea. There were no long-term trends evident in the data.

One of the most widely used measures of water quality is transparency. Most of Australia’s marine waters are highly transparent (i.e, a large secchi depth). Exceptions can be found in many estuaries and some coastal areas with high tidal currents that resuspend sediments. The high transparency is critical to the growth of organisms that are crucial to marine ecology such as phytoplankton, seagrass, seaweeds and corals. All marine animals depend on these organisms for food or habitat or both. 

Because of its ease of use, low cost and integrating nature, the Secchi disk is a valuable tool for the assessment of water quality.  It is well suited to citizen science projects and can provide robust assessments of water quality to help protect our aquatic ecosystems from degradation. It is particularly suited to monitoring in lakes, streams, rivers, estuaries and the coastal zone, where many pressures are causing widespread declines in water quality. More observations in different habitats would improve our knowledge of where more attention is needed to reduce any developing problems in water quality.

Falkowski, P. G., & Wilson, C. (1992). Phytoplankton productivity in the North Pacific ocean since 1900 and implications for absorption of anthropogenic CO2. Nature, 358(6389), 741-743. doi:10.1038/358741a0

Hou, W., Lee, Z., & Weidemann, A. D. (2007). Why does the Secchi disk disappear? An imaging perspective. Optics Express, 15(6), 2791-2802. doi:10.1364/OE.15.002791

Lee, Z., Shang, S., Hu, C., Du, K., Weidemann, A., Hou, W., . . . Lin, G. (2015). Secchi disk depth: A new theory and mechanistic model for underwater visibility. Remote Sensing of Environment, 169, 139-149. doi:10.1016/j.rse.2015.08.002

Morel, A., Huot, Y., Gentili, B., Werdell, P. J., Hooker, S. B., & Franz, B. A. (2007). Examining the consistency of products derived from various ocean color sensors in open ocean (Case 1) waters in the perspective of a multi-sensor approach. Remote Sensing of Environment, 111(1), 69-88. doi:0.1016/j.rse.2007.03.012

Preisendorfer, R. W. (1986). Secchi disk science: Visual optics of natural waters. Limnology and Oceanography, 31(5), 909-926. doi:10.4319/lo.1986.31.5.0909

Wernand, M. R. (2010). On the history of the Secchi disc. Journal of the European Optical Society - Rapid publications; Vol 5 (2010). Retrieved from https://www.jeos.org/index.php/jeos_rp/article/view/10013s

Yentsch, C. S. (1960). The influence of phytoplankton pigments on the colour of sea water. Deep Sea Research (1953), 7(1), 1-9. doi:10.1016/0146-6313(60)90002-2

Figure 1

Water transparency as estimated by MODIS satellite across the Australian region (50°S to equator, 100°E to 170°E) from 2003 to 2019.

Figure 2

Estimated mean monthly Secchi disk depth (m) across the Australian region (0-50°S, 100-170°E) from December 2002 to January 2019. Blue dashed line is least squares regression. Moderate seasonal and inter-annual is evident. There was no significant long-term trend in water transparency.

Figure 3

Estimated mean Secchi disk depth (m) across the Australian EEZ from December 2002 to January 2019.

Figure 4

Estimated mean monthly Secchi Disk Depth (m) for the Australian EEZ from December 2002 to January 2019. Blue dashed line is least squares regression. No long-term trend was detected.

Figure 5

Mean Secchi Disk Depth (m) for each bioregion over the period of analysis (2002-2019).

Figure 6

Seasonal cycle of water clarity estimated as Secchi Disk Depth (SDD, m) for Australia’s 6 bioregions (2003 – 2018).

Figure 7

Monthly average estimated Secchi disk depth (m) for each of the six Australian bioregions, from 2003 to 2018.

Figure 8

Mean measured Secchi Disk Depth (m) from monthly IMOS National Reference Stations from 2008 to 2017. Note that monitoring at Ningaloo (NIN) and Esperance (ESP) ceased in 2013 and that Kangaroo Island (KAI) and Darwin (DAR) have a quarterly sampling program.

Table 1

Secchi disk depth data from 2003-2018 in each bioregion.

Download this Time Series Report

Citing this report: 

Thompson P, McDonald K. (2020). Water clarity around Australia – satellite and in-situ observation. In Richardson A.J, Eriksen R, Moltmann T, Hodgson-Johnston I, Wallis J.R. (Eds). State and Trends of Australia’s Ocean Report. doi: 10.26198/5e16aafe49e80

doi: 10.26198/5e16aafe49e80

Access the Data

Access the data that contributes to this time-series by clicking the icons below

06f. National Reference stations-02

National Reference Stations

11. SRS-02

Satellite Remote Sensing

Citing the Report

Richardson A.J, Eriksen R, Moltmann T, Hodgson-Johnston I, Wallis J.R. (2020). State and Trends of Australia’s Ocean Report, Integrated Marine Observing System (IMOS).

IMOS_logo-stacked-reversed-01

The State and Trends of Australia's Ocean Report was supported by IMOS. IMOS gratefully acknowledges the additional support provided by the Commonwealth Scientific and Industrial Research Organisation (CSIRO).

The State and Trends of Australia's Ocean website is maintained by IMOS.


NCRIS-PROVIDER-REV

Australia’s Integrated Marine Observing System (IMOS) is enabled by the National Collaborative Research Infrastructure Strategy (NCRIS). It is operated by a consortium of institutions as an unincorporated joint venture, with the University of Tasmania as Lead Agent.

Disclaimer:

You accept all risks and responsibility for losses, damages, costs and other consequences resulting directly or indirectly from using this site and any information or material available from it. While the Integrated Marine Observing System (IMOS) has taken reasonable steps to ensure that the information on this website and related publication is correct, it provides no warranty or guarantee that information provided by the authors is accurate, complete or up-to-date. IMOS does not accept any responsibility or liability for any actions taken as a result of, or in reliance on, information on its website or publication. Users should check with the originating authors to confirm the accuracy of the information before taking any action in reliance on that information.

If you believe any information on this website or in the related publication is inaccurate, out of date or misleading, please bring it to our attention by contacting the authors directly or emailing us at IMOS@imos.org.au


Images and Information:

All information on this website remains the property of those who authored it. All images on this website are licensed through Adobe Stock, Shutterstock, or have permission from the original owner.