Biological Time Series - Marine Animals

4.5

Sounding out life in Australia's twilight zone

Contributors

Rudy Kloser1

Haris Kunnath1

1 CSIRO Oceans and Atmosphere, Hobart, TAS, Australia

Key Information

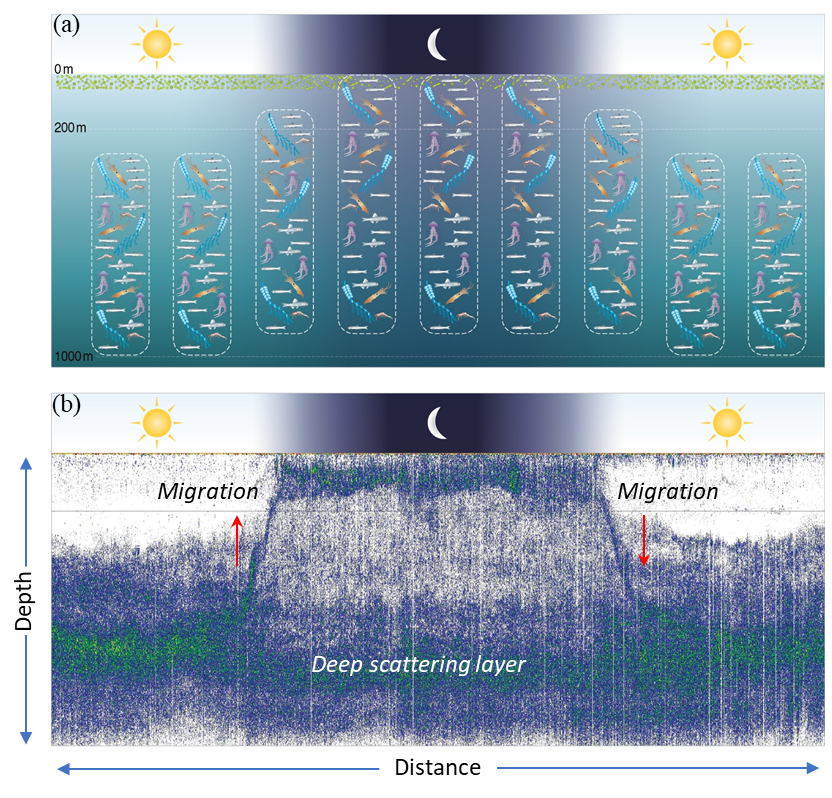
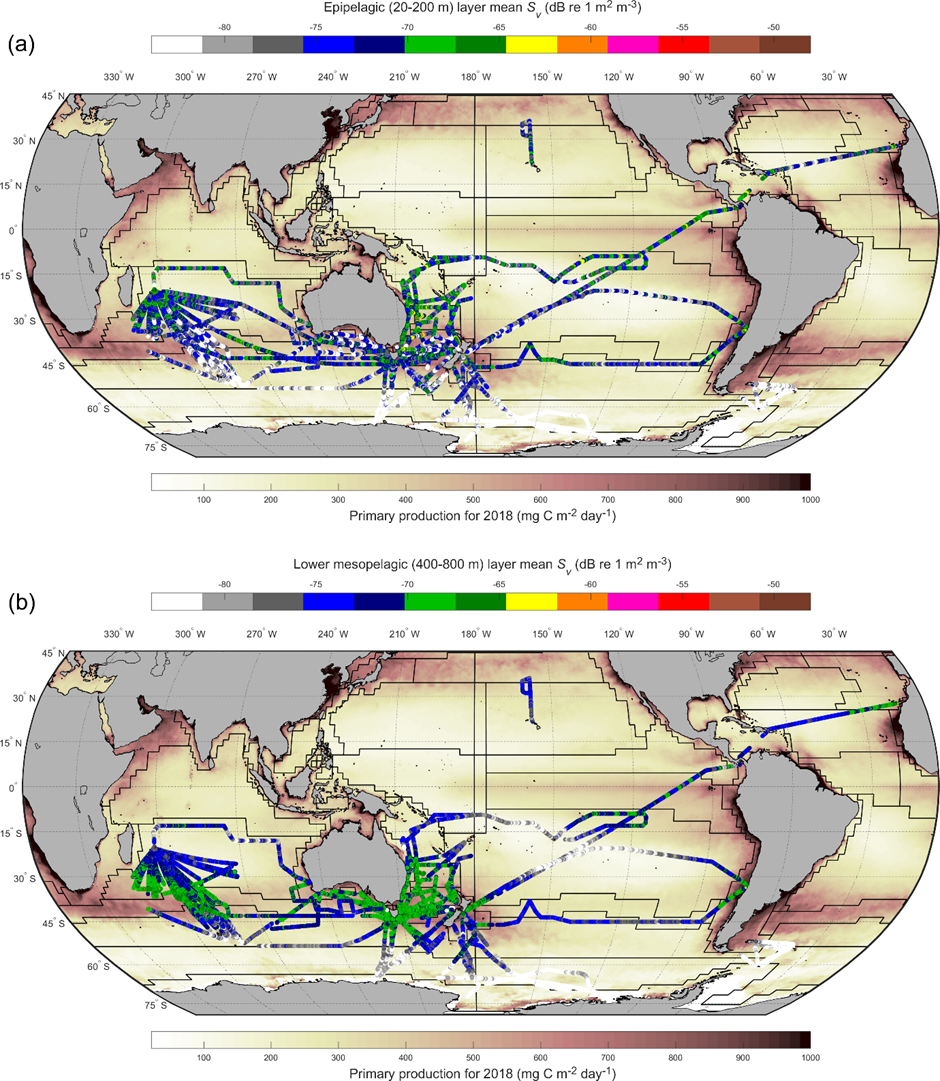
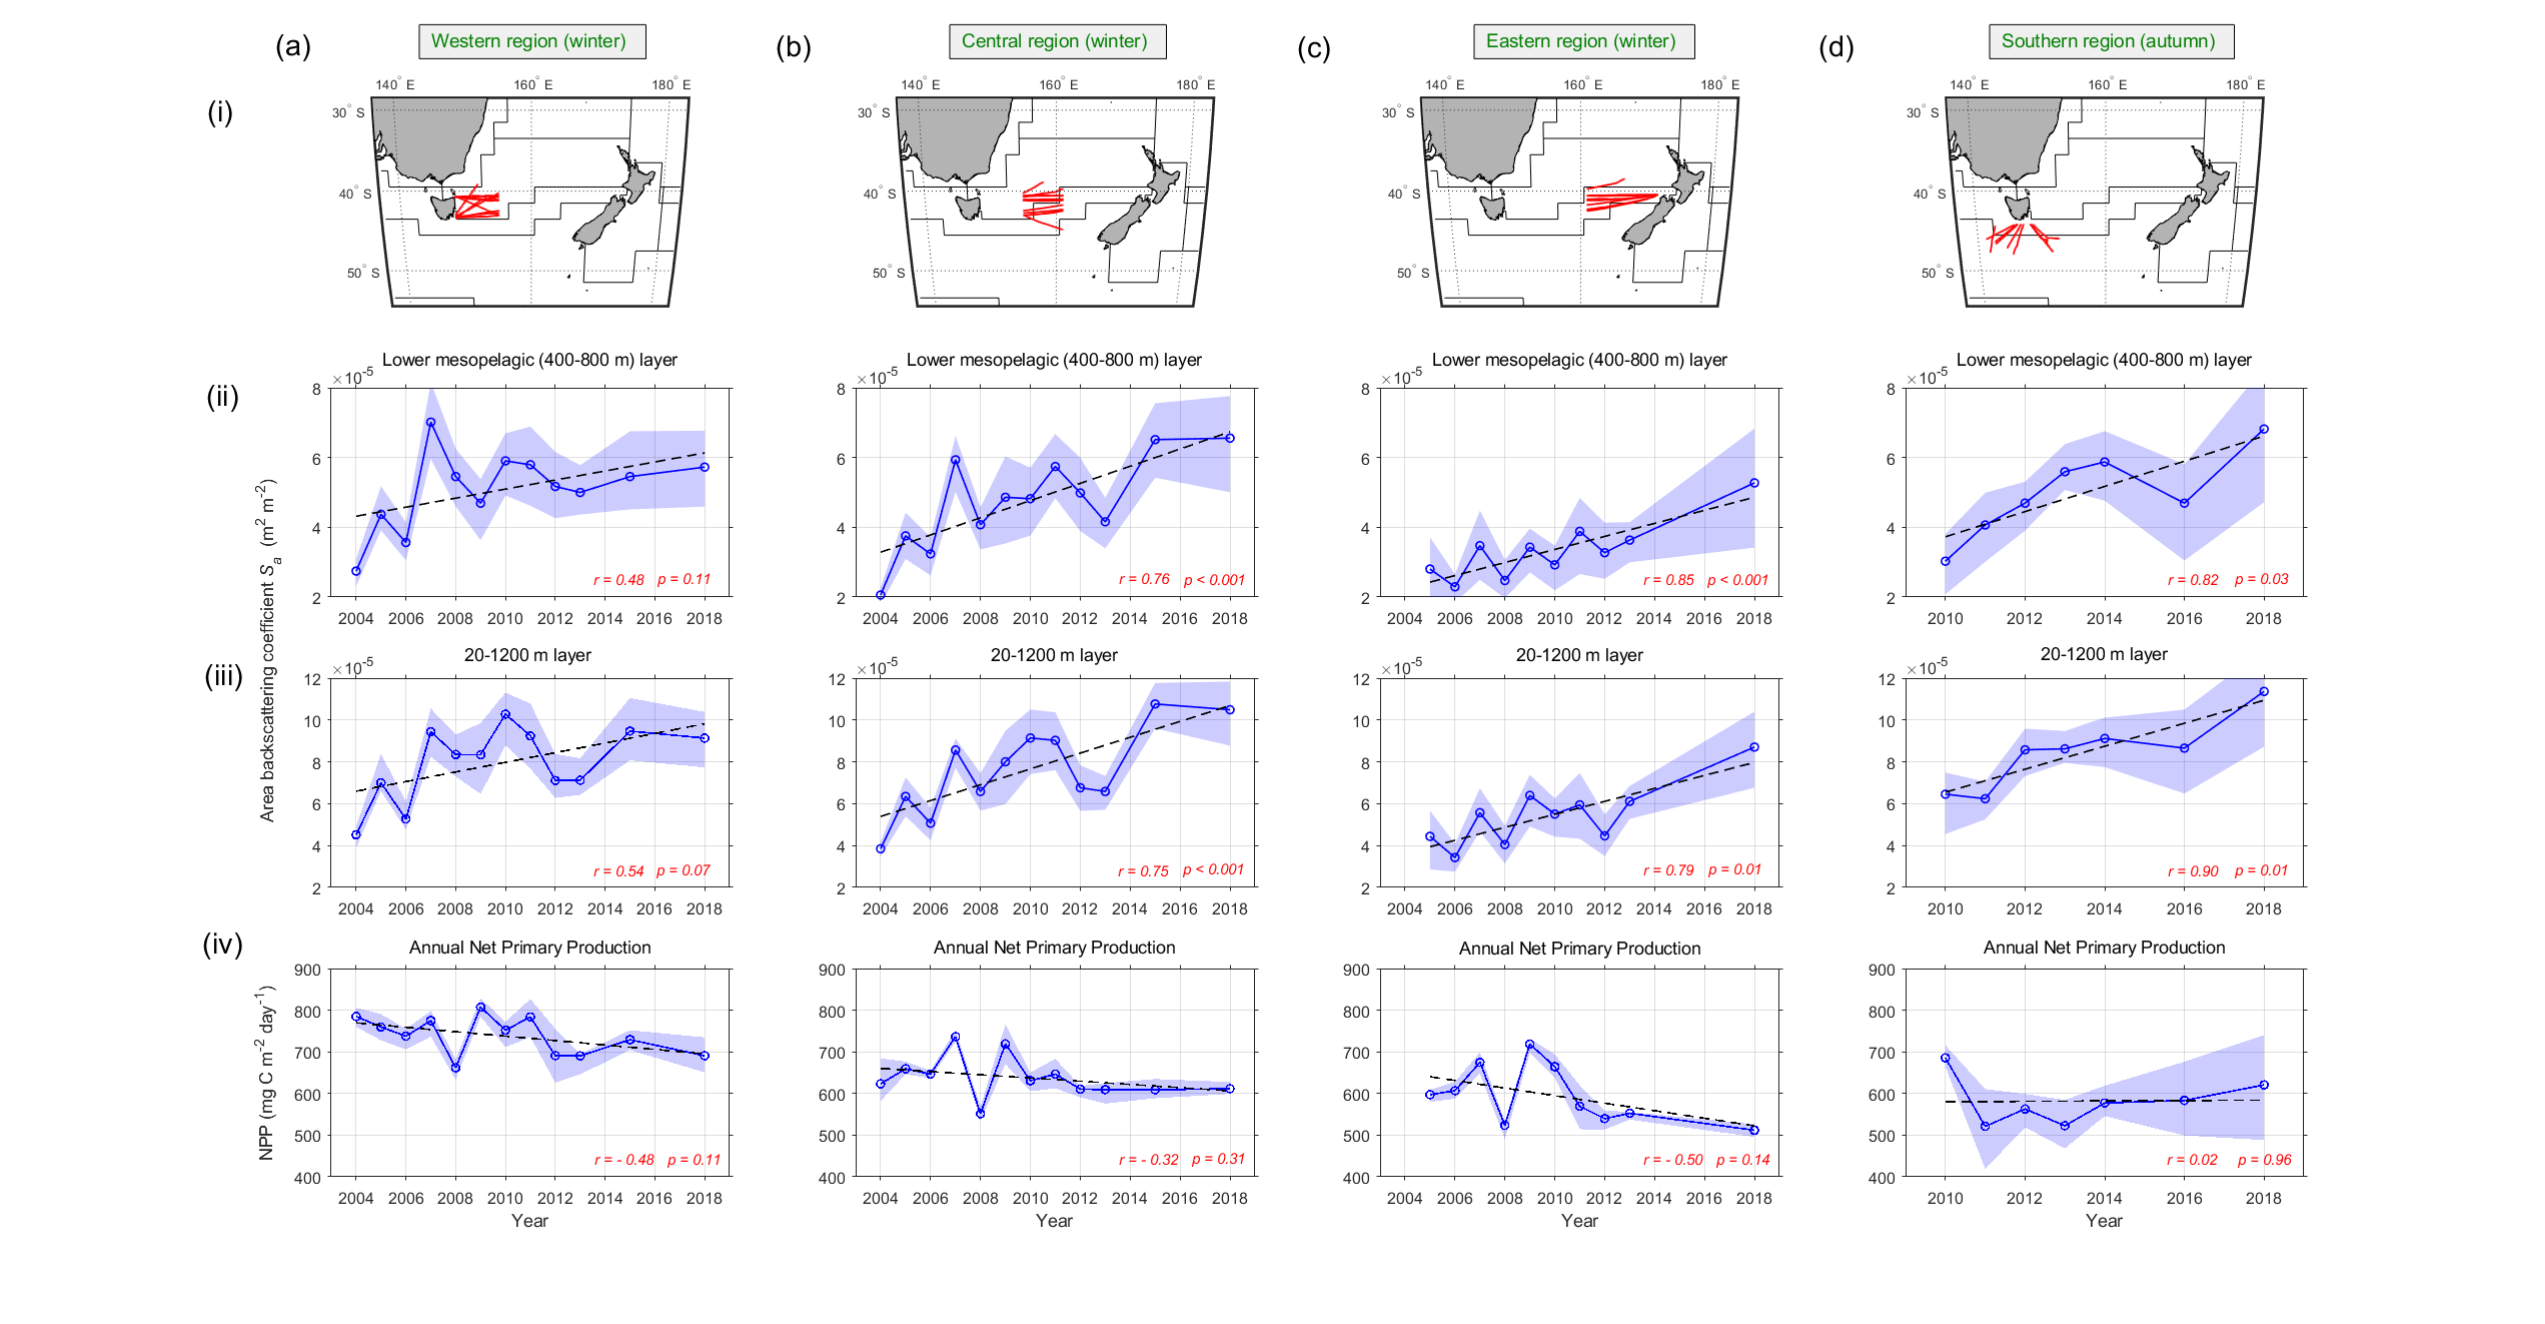
There is an increasing decadal trend in the Southern Australian Ocean twilight zone (200-1000 m depth) animals reflected sound. The twilight zone animals of fish, squids and zooplankton are an important aspect of the oceans, acting as predators and prey, storing carbon and as a potential food resource for humans. We now need to solve who, why and implication.

Keywords

fish, squid, zooplankton, acoustic backscatter, mesopelagic

Sounding out life in Australia's twilight zone

The world’s oceanic mesopelagic habitat (200–1000 m depth) is probably the largest unexplored region of the Earth (St. John et al., 2016). Recent research has highlighted that the fish biomass in the mesopelagic twilight zone – where there is very little light – could be between 2 to 20 billion tonnes. Most mesopelagic fish are currently unexploited, and it is likely that they will be increasingly harvested in the future for food and fish meal (St John et al., 2016). The mesopelagic zone also contributes substantially to active carbon sequestration (Davison et al., 2015; Proud et al., 2018), through vertical migration by fish, squid and zooplankton swimming toward the surface to feed during the night and returning to depth each day. This daily migration is the largest on Earth (Figure 1). To better understand the present biomass and structure of mesopelagic food webs, and how these change through time, we need long-term acoustic estimates. This information can inform ecosystem, carbon and Earth system models.

he Integrated Marine Observing System (IMOS) Ships of Opportunity Bio-Acoustics Facility provides ocean basin scale calibrated acoustic data, with snapshots of mesopelagic communities (Figure 2, Kloseret al., 2009). The main goal of the Bio-Acoustic Facility, operating since 2010, is to provide repeated observations for the status and trend of micronekton using echosounders on ships of opportunity. Key transects have been repeated across the Tasman Sea, Southern Ocean and the Indian Ocean. The Tasman Sea is separated into western, central and eastern regions (Flynn and Kloser 2012).

Acoustic data are calibrated (Demer et al., 2015), quality-controlled (Ryan et al., 2015) and have a resolution of 1 km in distance and 10 m in depth (Figure 1b). Since 2010, ~513,219km of data from 18 vessels have been processed and reside in the Australian Ocean Data Network (AODN) (www.aodn.org.au). Historical data (2004-2009) for the Tasman Sea were also sourced and processed in the same way (Kloser et al., 2009). Derived data are calibrated area backscattering coefficient sa (m2 m-2) that under appropriate conditions is linearly proportional to the density of dominant scattering organisms. Data are summarised into epipelagic (20–200 m), upper mesopelagic (200–400 m) and lower mesopelagic (400–800 m) layers. Although multiple frequencies are collected, only the 38 kHz data series constituting 82% of the total data is used here. Data are tagged with location, date, time of day, and an estimate of net primary production (NPP, from a Vertically Generalized Production Model) averaged for the year prior to acquiring the acoustic data.

The 38 kHz acoustic backscatter data highlight large spatial variations at the basin scale that generally follow the Longhurst bioregions based on NPP (Figure 2). However, there are notable differences at the boundaries and within several regions for the lower mesopelagic layer (e.g. the low nutrient central south Pacific and Indian southern subtropical gyre province around Mauritius). The IMOS data have been used to test the current Longhurst pelagic bioregions (Longhurst, 2007; Proud et al., 2017), and as more data are collected, they can be used to produce a more refined pelagic bioregionalisation around Australia and the Southern Ocean.

From 2004-2018, there is an increasing linear trend in winter acoustic backscatter (with different magnitudes) in the Western (by 42%), Central (105%) and Eastern regions (100%) of Tasman Sea (Figure 3a-c). The increasing trend is also evident for the water column from 20–1200 m, as the lower mesopelagic represents 60-70% of the total acoustic backscatter. Trends in annual-averaged NPP at the sampling locations have either no trend or are slightly negative compared to the increasing acoustic trend for all three Tasman Sea regions. Correlation between annual NPP and snapshot acoustic data may not reflect the different temporal and spatial scales of the NPP and biology responsible for the acoustic scattering. The 38 kHz acoustic data are measuring a biological response from resonant scattering of fish and siphonophores in the gas-bladder size range of ~0.4-1.0 mm equivalent spherical radius (Kloser et al., 2016). Due to their age, these animals may have been transported some distance from the original primary production source.

For the Southern Ocean region (Figure 3d), there is an increasing trend (by 77% from 2010-2018) in acoustic data in late summer to autumn, but there is no clear trend in NPP (Figure 3d-iv). The most plausible explanation for the increasing trend in the acoustic signal is that the number of organisms that have resonant gas bladders in the size range ~0.4 to 1.0 mm has increased in the lower mesopelagic regions sampled (Kloser et al., 2016). It appears the rate of increase is greatest for the Southern region (Figure 3d-ii). Although there are other potential explanations for the rise in backscatter, it is unlikely to be driven by measurement bias, given the temporal scale and diversity of vessels used. The validity of this interpretation, the mechanism causing this increase, and its significance need to be confirmed through net and acoustic/optical probe sampling.  


Open ocean mesopelagic communities are a key ocean resource with an extremely large biomass that links pelagic and benthic systems. They also play an active role in carbon sequestration. The IMOS data provide the first decade-long, publicly accessible time series of mesopelagic bioacoustics anywhere in the world. The bio-acoustic time series of the structure and change of key components of the biology to 1200 m highlights a significant increasing trend (between 40–105% from 2004-2018) in the acoustic backscatter (400–800 m) for the Tasman Sea and Southern Ocean Time Series region. This likely increase in organisms may increase the active process of carbon sequestration. There has been some interest in harvesting these communities for protein and oils, though currently not in Australian waters. However, fishery sustainability and ecological impacts would need to be assessed prior to any activity or significant harvesting.

Davison, P. C., Koslow, J. A., & Kloser, R. J. (2015). Acoustic biomass estimation of mesopelagic fish: backscattering from individuals, populations, and communities. ICES Journal of Marine Science, 72(5), 1413-1424. doi:10.1093/icesjms/fsv023

Demer, D., Berger, L., Bernasconi, M., Bethke, E., Boswell, K., Chu, D., . . . Gauthier, S. (2015). Calibration of acoustic instruments. ICES Cooperative Research Report, 326, 133.

Flynn, A., & Kloser, R. (2012). Cross-basin heterogeneity in lanternfish (family Myctophidae) assemblages and isotopic niches (δ13C and δ15N) in the southern Tasman Sea abyssal basin. Deep Sea Research Part I: Oceanographic Research Papers, 69, 113-127.

Kloser, R. J., Ryan, T. E., Keith, G., & Gershwin, L. (2016). Deep-scattering layer, gas-bladder density, and size estimates using a two-frequency acoustic and optical probe. ICES Journal of Marine Science, 73(8), 2037-2048. doi:10.1093/icesjms/fsv257

Kloser, R. J., Ryan, T. E., Young, J. W., & Lewis, M. E. (2009). Acoustic observations of micronekton fish on the scale of an ocean basin: potential and challenges. ICES Journal of Marine Science, 66(6), 998-1006. doi:10.1093/icesjms/fsp077

Longhurst, A. R. (2007). Ecological Geography of the Sea (Second ed.): Academic Press.
Proud, R., Cox, M. J., & Brierley, A. S. (2017). Biogeography of the global ocean’s mesopelagic zone. Current Biology, 27(1), 113-119.

Proud, R., Handegard, N. O., Kloser, R. J., Cox, M. J., Brierley, A. S., & Handling editor: David, D. (2018). From siphonophores to deep scattering layers: uncertainty ranges for the estimation of global mesopelagic fish biomass. ICES Journal of Marine Science. doi:10.1093/icesjms/fsy037

Ryan, T. E., Downie, R. A., Kloser, R. J., & Keith, G. (2015). Reducing bias due to noise and attenuation in open-ocean echo integration data. ICES Journal of Marine Science, 72(8), 2482-2493. doi:10.1093/icesjms/fsv121

St. John, M. A., Borja, A., Chust, G., Heath, M., Grigorov, I., Mariani, P., . . . Santos, R. S. (2016). A Dark Hole in Our Understanding of Marine Ecosystems and Their Services: Perspectives from the Mesopelagic Community. Frontiers in Marine Science, 3(31). doi:10.3389/fmars.2016.00031

Figure 1

An example of diel vertical migration in the mesopelagic zone. (a) A stylised micronekton ecosystem (fish, squid, jellyfish and other zooplankton ~2-20 cm in size), many of which exhibit daily vertical migration. (b) Acoustic observations at 38 kHz (the deep scattering layer is indicated).

Figure 2

The mean volume backscattering strength Sv (dB re 1 m2 m-3) at 38 kHz for the IMOS BASOOP data. (a) Epipelagic layer (20–200 m depth) highlighting basin-scale diel vertical migration. (b) The lower mesopelagic layer (400–800 m depth). The 2018 annual averaged net primary production (mgC/m2/d) is shaded in brown and Longhurst bioregions as black lines. Acoustic data in Scotia Sea were sourced from www.mesopp.eu.

Figure 3

Trend in the acoustic time series for the Tasman Sea [(a) Western, (b) Central, and (c) Eastern regions] and (d) Southern Ocean highlighting, (ii) lower mesopelagic layer (400–800 m), (iii) full measured water column (20–1200 m) and, (iv) the annual net primary production. A fit to a linear trend (dashed line) with, correlation coefficient (r) and significance (p-value) in red, the 25 and 75% quantile of the data values are shaded as light blue.

Download this Time Series Report

Citing this report: 

Kloser R, Kunnath H. (2020) Sounding out life in Australia’s twilight zone. In Richardson A.J, Eriksen R, Moltmann T, Hodgson-Johnston I, Wallis J.R. (Eds). State and Trends of Australia’s Ocean Report. doi: 10.26198/5e16b0ef49e8a

doi: 10.26198/5e16b0ef49e8a

Access the Data

Access the data that contributes to this time-series by clicking the icons below

02. SOOP-02

Ships of Opportunity

Citing the Report

Richardson A.J, Eriksen R, Moltmann T, Hodgson-Johnston I, Wallis J.R. (2020). State and Trends of Australia’s Ocean Report, Integrated Marine Observing System (IMOS).

IMOS_logo-stacked-reversed-01

The State and Trends of Australia's Ocean Report was supported by IMOS. IMOS gratefully acknowledges the additional support provided by the Commonwealth Scientific and Industrial Research Organisation (CSIRO).

The State and Trends of Australia's Ocean website is maintained by IMOS.


NCRIS-PROVIDER-REV

Australia’s Integrated Marine Observing System (IMOS) is enabled by the National Collaborative Research Infrastructure Strategy (NCRIS). It is operated by a consortium of institutions as an unincorporated joint venture, with the University of Tasmania as Lead Agent.

Disclaimer:

You accept all risks and responsibility for losses, damages, costs and other consequences resulting directly or indirectly from using this site and any information or material available from it. While the Integrated Marine Observing System (IMOS) has taken reasonable steps to ensure that the information on this website and related publication is correct, it provides no warranty or guarantee that information provided by the authors is accurate, complete or up-to-date. IMOS does not accept any responsibility or liability for any actions taken as a result of, or in reliance on, information on its website or publication. Users should check with the originating authors to confirm the accuracy of the information before taking any action in reliance on that information.

If you believe any information on this website or in the related publication is inaccurate, out of date or misleading, please bring it to our attention by contacting the authors directly or emailing us at IMOS@imos.org.au


Images and Information:

All information on this website remains the property of those who authored it. All images on this website are licensed through Adobe Stock, Shutterstock, or have permission from the original owner.